
What Is Statistical Significance
Introduction
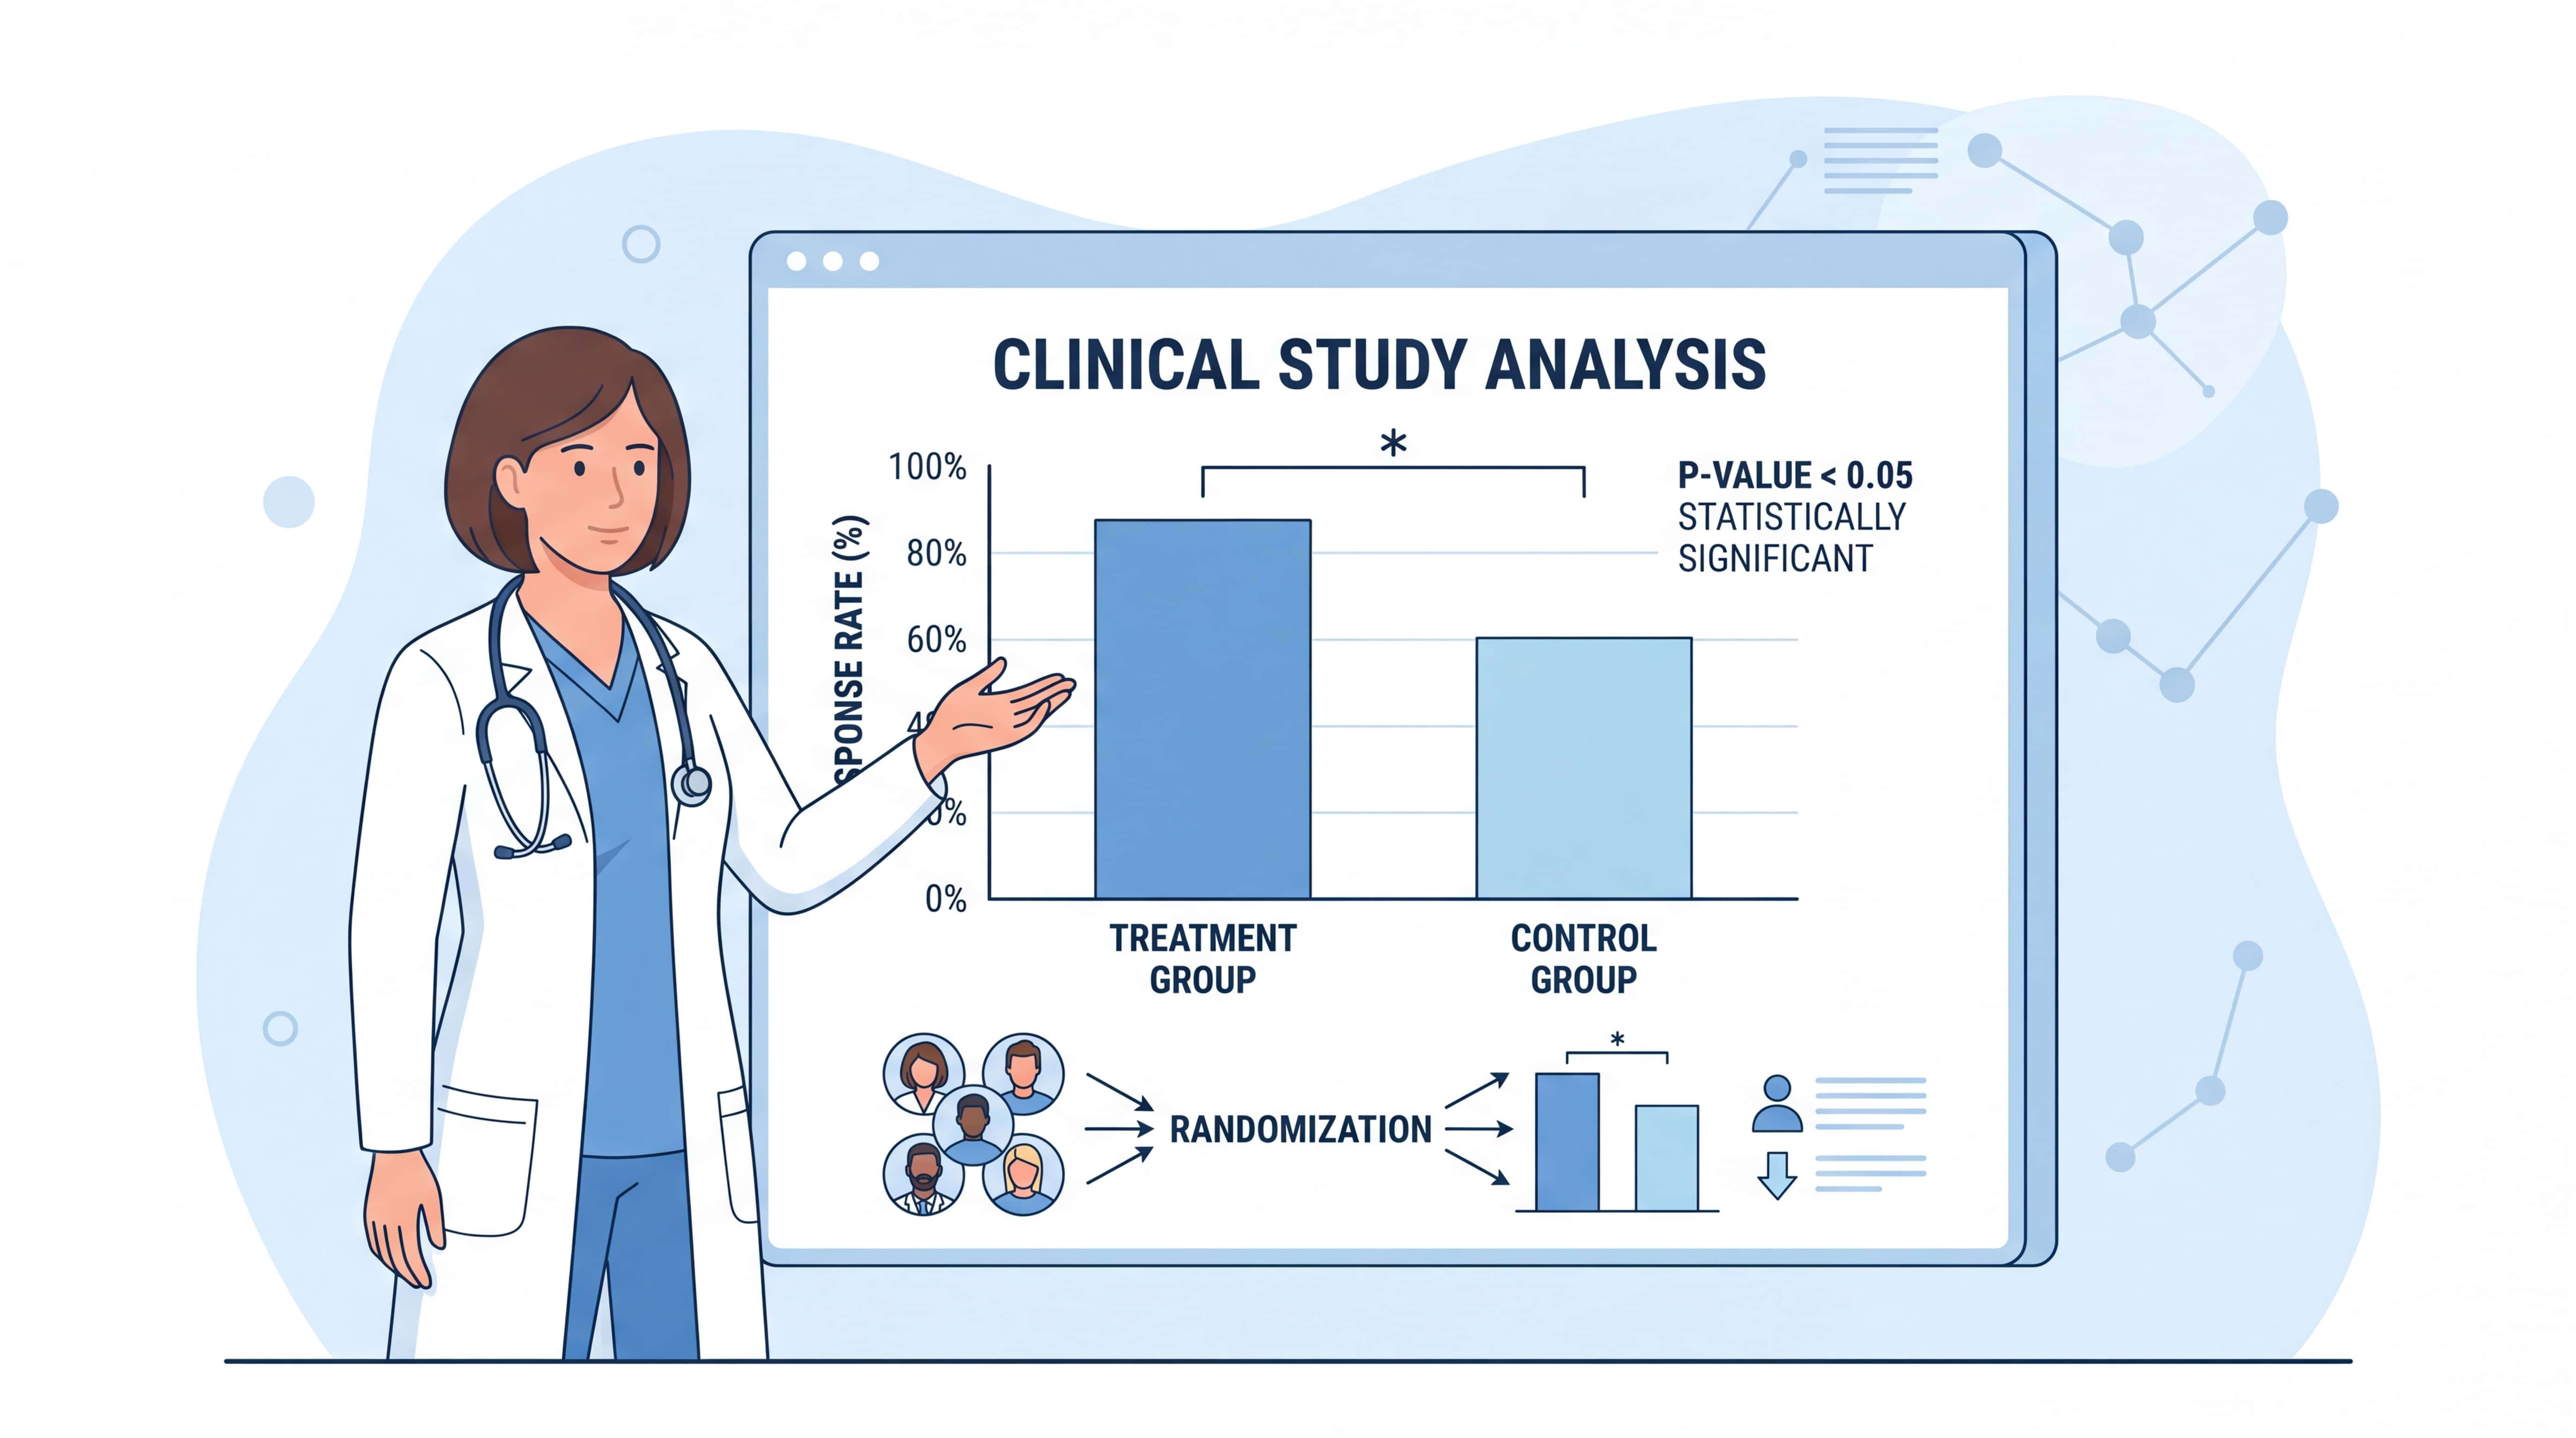
Statistical significance is the key idea that tells you whether an observed difference is likely real or just due to chance. For medical students, physicians, and researchers, this matters every day when comparing treatment groups, biomarkers, or clinical outcomes. If you misread a p-value, you may overstate a result or miss an important finding. In this essay, we explain what statistical significance means, how it is tested, and how to report it correctly in clinical research.
1. The Core Idea Behind Statistical Significance
1.1 From Sample Data to Population Inference
Statistical analysis starts with a basic problem. We only observe a sample, but we want to infer what is happening in the population. That is why statistical significance exists. It helps us judge whether a difference in the sample is strong enough to suggest a true effect beyond random variation.
In clinical research, this is especially important. A higher mean in one group does not automatically prove a real difference. The result may come from sampling error. Statistical significance asks a specific question: if the null hypothesis were true, how likely would we see a result this extreme by chance?
This is the logic behind many common tests, including the independent-samples t-test. We first assume no difference between groups. Then we calculate a test statistic, usually a t value, and convert it into a p-value using the t distribution.
1.2 Why P Values Matter
A p-value is not the size of the effect. It is the probability of seeing data as extreme as, or more extreme than, the observed result if the null hypothesis is true. In practice, a p-value below 0.05 is often used as the threshold for statistical significance.
That threshold is based on alpha, the maximum acceptable risk of a Type I error. A Type I error means concluding there is a difference when there is none. In most clinical studies, alpha is set at 0.05, although it can be lower in high-stakes research.
A p-value tells you about probability under the null hypothesis, not about clinical importance. A small p-value does not guarantee a large or meaningful effect.
2. How Statistical Significance Is Tested
2.1 The Hypothesis Testing Framework
Statistical significance comes from hypothesis testing. The null hypothesis usually states that there is no difference or no association. The alternative hypothesis states that a difference or association exists.
This structure is used because science needs a clear baseline. If we do not start from “no effect,” we cannot measure how surprising the data are. That is why the null hypothesis is the default starting point in statistical testing.
A useful way to think about this is the jury model. A court starts with the presumption of innocence. In statistics, we start with the assumption of no effect. Only strong evidence allows us to reject that assumption.
2.2 Alpha, Beta, and Statistical Power
Two error types are central here:
- Type I error: false positive, rejecting a true null hypothesis.
- Type II error: false negative, failing to reject a false null hypothesis.
Alpha controls Type I error. Beta reflects Type II error. Power is 1 minus beta. It is the probability of detecting a true effect when it exists.
In clinical and biomedical studies, power is often set around 80% to 95%, depending on the study purpose and expected risk of missing a real effect. A study with low power can produce non-significant results even when an effect truly exists.
2.3 The Role of the t-Test in Group Comparisons
When comparing two independent groups, the independent-samples t-test is one of the most common tools. It tests whether the group means differ more than would be expected by chance.
The procedure is straightforward:
- Define the null hypothesis.
- Calculate the t statistic from the sample data.
- Use the t distribution and degrees of freedom to obtain the p-value.
- Compare the p-value with alpha.
- Decide whether the result is statistically significant.
If p < 0.05, the result is usually described as statistically significant, not “very significant.” That wording is outdated and misleading. Significance is not the same as effect size.
3. Common Misunderstandings in Medical Research
3.1 Statistical Significance Is Not Clinical Importance
One of the most common errors is to treat statistical significance as proof of practical importance. That is incorrect. A very small difference can be statistically significant in a large sample, while a clinically meaningful difference may fail to reach significance in a small sample.
For example, a group mean difference of 0.3 may be statistically significant in a large dataset, but it may have little clinical value. On the other hand, a larger difference may not reach significance if the sample size is too small or the data are too variable.
Always separate statistical significance from clinical relevance. They answer different questions.
3.2 Why P < 0.001 Is Not “More Significant” in a Simple Sense
Another mistake is to say p < 0.001 means the finding is “more significant” than p < 0.05. Strictly speaking, both are statistically significant if the chosen alpha is 0.05. The smaller p-value only indicates stronger evidence against the null hypothesis.
It does not tell you the effect is larger. It does not mean the result is more important for patient care. It only means the observed data would be less likely under the null hypothesis.
3.3 Report the Effect Size and Confidence Interval
A good research report should not stop at p-values. It should also include:
- Mean difference or other effect size.
- Confidence interval.
- Sample size.
- Test used.
- Exact p-value when possible.
These elements give a fuller picture. They show both statistical evidence and the precision of the estimate. In evidence-based medicine, that is far more useful than a bare claim of “significance.”
4. Practical Guidance for Reading and Writing Research Results
4.1 How to Interpret Results Correctly
When you read a paper, ask four questions:
- What was the null hypothesis?
- Which statistical test was used?
- What was the exact p-value?
- What was the size of the difference?
If the paper only says “the difference was significant,” the reporting is incomplete. You need the actual numbers to judge the finding properly.
In clinical studies, the best interpretation often combines statistics and context. A small p-value may support a real effect, but you still need to evaluate bias, confounding, measurement quality, and biological plausibility.
4.2 A Simple Reporting Rule
When writing results, use precise language.
Prefer:
- “The difference was statistically significant.”
- “The mean difference was 4.2 units.”
- “The p-value was 0.03.”
Avoid:
- “The difference was very significant.”
- “The result proves the treatment works.”
- “P < 0.05 means the effect is large.”
Clear reporting improves trust, reproducibility, and scientific value.
4.3 Why Software Is Useful
Many researchers understand the concept but struggle with the calculations. That is normal. In practice, software is used to compute the t statistic, p-value, and confidence intervals quickly and accurately.
This is where tools like scifocus.ai can help. It supports researchers who need a faster workflow for statistical writing, result interpretation, and research communication. For busy clinicians and students, a reliable AI-assisted platform can reduce time spent on formatting and drafting, while helping maintain clarity and consistency.
Conclusion
Statistical significance is a core concept in medical research. It tells you whether an observed result is unlikely to be explained by chance alone, given a specific null hypothesis. But it is only one part of interpretation. A statistically significant result is not automatically clinically important, and a non-significant result is not proof of no effect.
For medical students, doctors, and researchers, the best practice is to combine p-values, effect sizes, confidence intervals, and study context. That is how you make sound scientific judgments. If you want to streamline research writing and improve clarity in statistical reporting, explore scifocus.ai as a practical support tool for your next essay or manuscript.

Did you like this article? Explore a few more related posts.
Start Your Research Journey With Scifocus Today
Create your free Scifocus account today and take your research to the next level. Experience the difference firsthand—your journey to academic excellence starts here.