

Introduction
Meta-analysis is often the fastest way to make sense of conflicting research. For medical students, doctors, and researchers, the challenge is not finding studies, but deciding which evidence is trustworthy. A well-done essay on meta-analysis should explain what it is, when to use it, and how to read the results correctly. It is a statistical method, not just a literature summary. Understanding meta-analysis helps you move from isolated findings to stronger clinical decisions.
1. What Meta-Analysis Really Means
1.1 A statistical method for combining studies
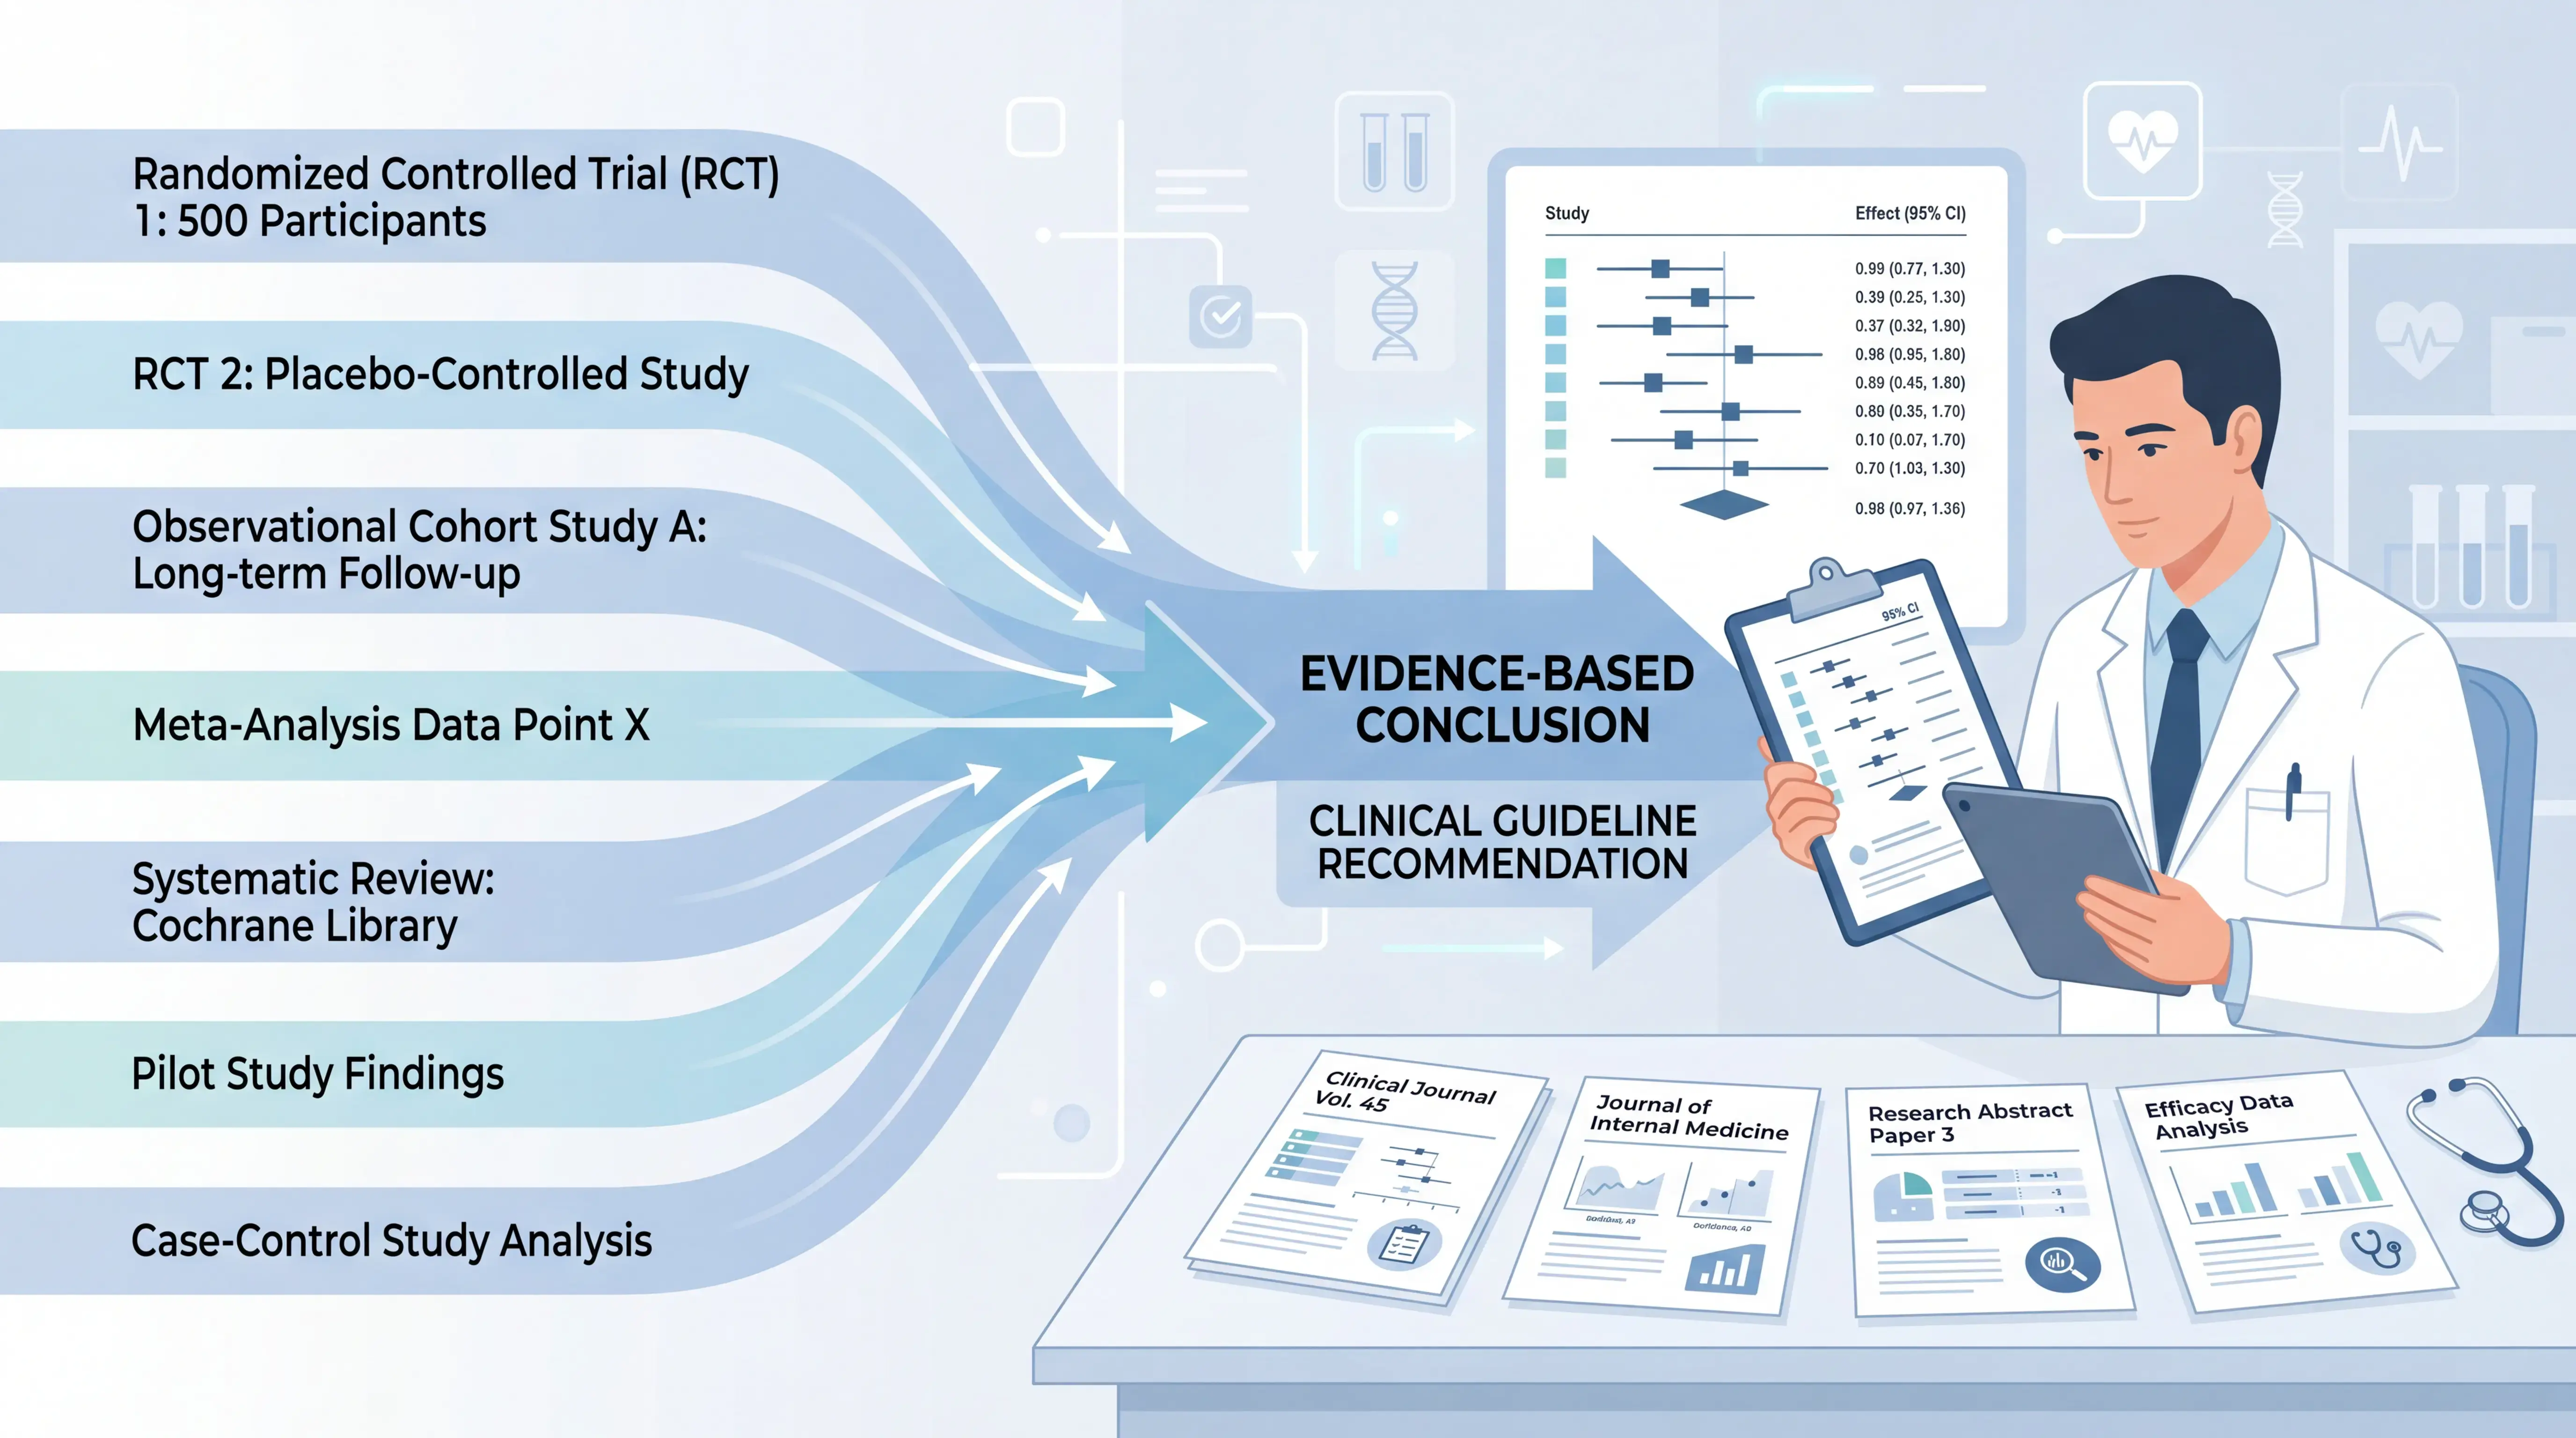
Meta-analysis combines results from multiple studies on the same question, as long as they meet specific criteria. The goal is to increase sample size and improve statistical power. This matters when individual studies report different, even contradictory, outcomes.
In evidence-based medicine, meta-analysis sits near the top of the evidence pyramid. It does not replace good studies. Instead, it helps synthesize them into one quantitative estimate. The first medical meta-analysis was published in 1904, showing that this approach has a long history.
A meta-analysis is not a simple review. It is a formal statistical synthesis.
1.2 Meta-analysis and systematic review are not the same
These two terms are often confused. A systematic review is a structured process of searching, selecting, and appraising studies. A meta-analysis is the statistical pooling step, and it is only performed when the studies are sufficiently similar.
If the studies are too heterogeneous, researchers may conduct only a qualitative systematic review. In other words, a systematic review can exist without meta-analysis, but meta-analysis usually depends on a structured review process.
1.3 Why it matters in clinical research
Meta-analysis is especially useful when one trial is too small to answer a clinical question. It can clarify treatment effects, diagnostic accuracy, prognosis, or adverse events. For clinicians, it helps reduce uncertainty. For researchers, it identifies research gaps. For students, it builds critical appraisal skills.
2. When a Meta-Analysis Is Appropriate
2.1 Choose a question with clinical value
A strong topic should address a practical and unresolved question. Good topics often involve treatment efficacy, diagnostic uncertainty, or controversial findings. If the answer is already clear, a new meta-analysis adds little value.
This is why topic selection is one of the most important steps. A strong topic can determine half the quality of the entire project. In recent years, meta-analysis publications have continued to increase, but the growth rate has slowed. That makes originality and clinical relevance more important than ever.
2.2 Avoid weak or redundant topics
Not every idea is worth turning into an essay or a meta-analysis. Poor choices include questions that are already settled, or topics where a recent meta-analysis exists but no new studies have appeared. In that case, the update offers little new evidence.
Useful topics usually meet at least one of these conditions:
- They address an important clinical decision.
- They remain uncertain or controversial.
- They have enough comparable studies.
- They have clear and measurable outcomes.
2.3 Similarity among studies is essential
A meta-analysis only works well when the included studies are similar enough in design, population, intervention, and outcomes. If the studies are too different, pooling them may create misleading results.
This is why heterogeneity is central to interpretation. Before combining data, researchers must ask whether the studies are clinically and methodologically compatible.
3. Common Types of Meta-Analysis
3.1 Different data types require different methods
Meta-analysis is not one single format. It can be applied to several research types, including:
- Continuous outcomes
- Binary outcomes
- Diagnostic accuracy studies
- Proportion or rate data
- Survival data
- Dose-response relationships
- Network meta-analysis
- Adverse event analysis
- Cost-effectiveness analysis
Among these, continuous and binary outcome meta-analyses are the most common.
3.2 Effect measures must match the data
The outcome type determines the statistic used. For continuous data, researchers often use weighted mean difference, or WMD, when units are the same. If the scales differ, standardized mean difference, or SMD, is used.
For binary outcomes, common effect measures include:
- Odds ratio, or OR
- Risk ratio, or RR
- Hazard ratio, or HR
Using the wrong effect measure can distort interpretation. For example, OR is common in case-control studies, RR is often used in cohort or trial data, and HR is used in survival analysis.
3.3 Data extraction needs precision
Reliable meta-analysis depends on accurate extraction. For continuous outcomes, reviewers need means and standard deviations. For binary outcomes, they need event counts and total sample sizes. Missing or inconsistent data can weaken the final result.
That is why careful preparation matters as much as statistical software. Even the best software cannot fix poor source data.
4. How to Interpret a Meta-Analysis Correctly
4.1 Start with the forest plot
The forest plot is one of the most important figures in a meta-analysis. It shows the effect estimate of each study and the pooled result. Each line represents one study, and the diamond represents the combined effect.
When reading a forest plot, focus on three things:
- The direction of effect.
- The confidence interval.
- Whether the pooled estimate crosses the no-effect line.
If the confidence interval crosses the no-effect line, the result may not be statistically significant. But statistical significance alone is not enough. You also need to judge clinical relevance.
4.2 Read the confidence interval, not just the p-value
A p-value tells you whether the result is statistically significant. It does not tell you how large or how precise the effect is. The 95% confidence interval is often more informative because it shows the plausible range of the true effect.
A narrow confidence interval suggests greater precision. A wide interval suggests uncertainty.
If the interval is wide, the pooled estimate may be unstable, especially if the included studies are small or inconsistent.
4.3 Check heterogeneity carefully
Heterogeneity means variation between study results. It can come from differences in patients, interventions, outcomes, or methods. Common statistical measures include Q test and I².
A practical reading guide is:
- I² around 25% suggests low heterogeneity.
- I² around 50% suggests moderate heterogeneity.
- I² above 75% suggests high heterogeneity.
If heterogeneity is present, researchers often use a random-effects model. If it is low, a fixed-effect model may be appropriate. The model choice directly affects the pooled estimate, so it should never be ignored.
4.4 Look for sources of heterogeneity
If results differ widely, subgroup analysis may help explain why. For example, studies may differ by:
- Age group
- Disease severity
- Region or population
- Diagnostic method
- Study year
- Sample size
Subgroup analysis can improve interpretation, but it should be planned and clinically justified. Otherwise, it may lead to overinterpretation.
4.5 Assess sensitivity and publication bias
Sensitivity analysis tests whether the overall result changes when one study is removed. If removing a single paper reverses the conclusion, the result is fragile.
Publication bias is another major concern. Studies with positive results are more likely to be published than negative ones. This can make the pooled effect look stronger than it really is. Funnel plots and related tests are often used to explore this problem.
5. Practical Steps for Reading a Meta-Analysis
5.1 A simple checklist
When you read a meta-analysis, use this order:
- Identify the research question.
- Check the inclusion criteria.
- Review the study types and population.
- Look at the effect measure.
- Read the forest plot.
- Assess heterogeneity.
- Check sensitivity analysis.
- Evaluate publication bias.
- Judge whether the conclusion matches the data.
This sequence helps prevent selective reading. It also keeps the focus on methodology rather than on a single headline result.
5.2 Ask whether the conclusion is clinically meaningful
A statistically significant result may still have limited clinical value. A small reduction in risk may not justify higher cost, more adverse effects, or greater complexity. That is why interpretation should combine statistics with clinical context.
For doctors and researchers, the most useful question is not only, “Is it significant?” but also, “Does it change practice?”
5.3 Use the right tools for efficiency
Manual reading of meta-analyses is time-consuming. Tools like RevMan and Stata are often used for statistical synthesis, but interpretation still requires judgment. This is where AI-assisted research workflows can help.
Platforms such as scifocus.ai can support literature organization, evidence synthesis, and faster drafting. For busy medical students and researchers, this can reduce repetitive work and help you focus on what matters most, the quality of the evidence.
6. Conclusion
Meta-analysis is one of the most powerful methods in evidence-based medicine. It combines comparable studies, increases statistical power, and helps resolve conflicting findings. But it only works well when the question is well chosen, the studies are sufficiently similar, and the results are interpreted with care.
If you want to write a rigorous essay on this topic, remember the core steps. Define the question, assess heterogeneity, read the confidence interval, and judge clinical relevance. Do not stop at the pooled estimate. Interpretation is where real value begins.
For faster and more organized evidence work, consider using scifocus.ai to support your research workflow, improve efficiency, and turn complex evidence into clearer academic output.

Did you like this article? Explore a few more related posts.
Start Your Research Journey With Scifocus Today
Create your free Scifocus account today and take your research to the next level. Experience the difference firsthand—your journey to academic excellence starts here.