

Understanding P-Values and Statistical Significance
Introduction
In medical research, a single essay or paper can be weakened by one mistake: misreading the p-value. For medical students, physicians, and researchers, this often leads to wrong conclusions about whether a treatment works. Understanding p-values and statistical significance is essential for turning sample data into sound clinical inference.
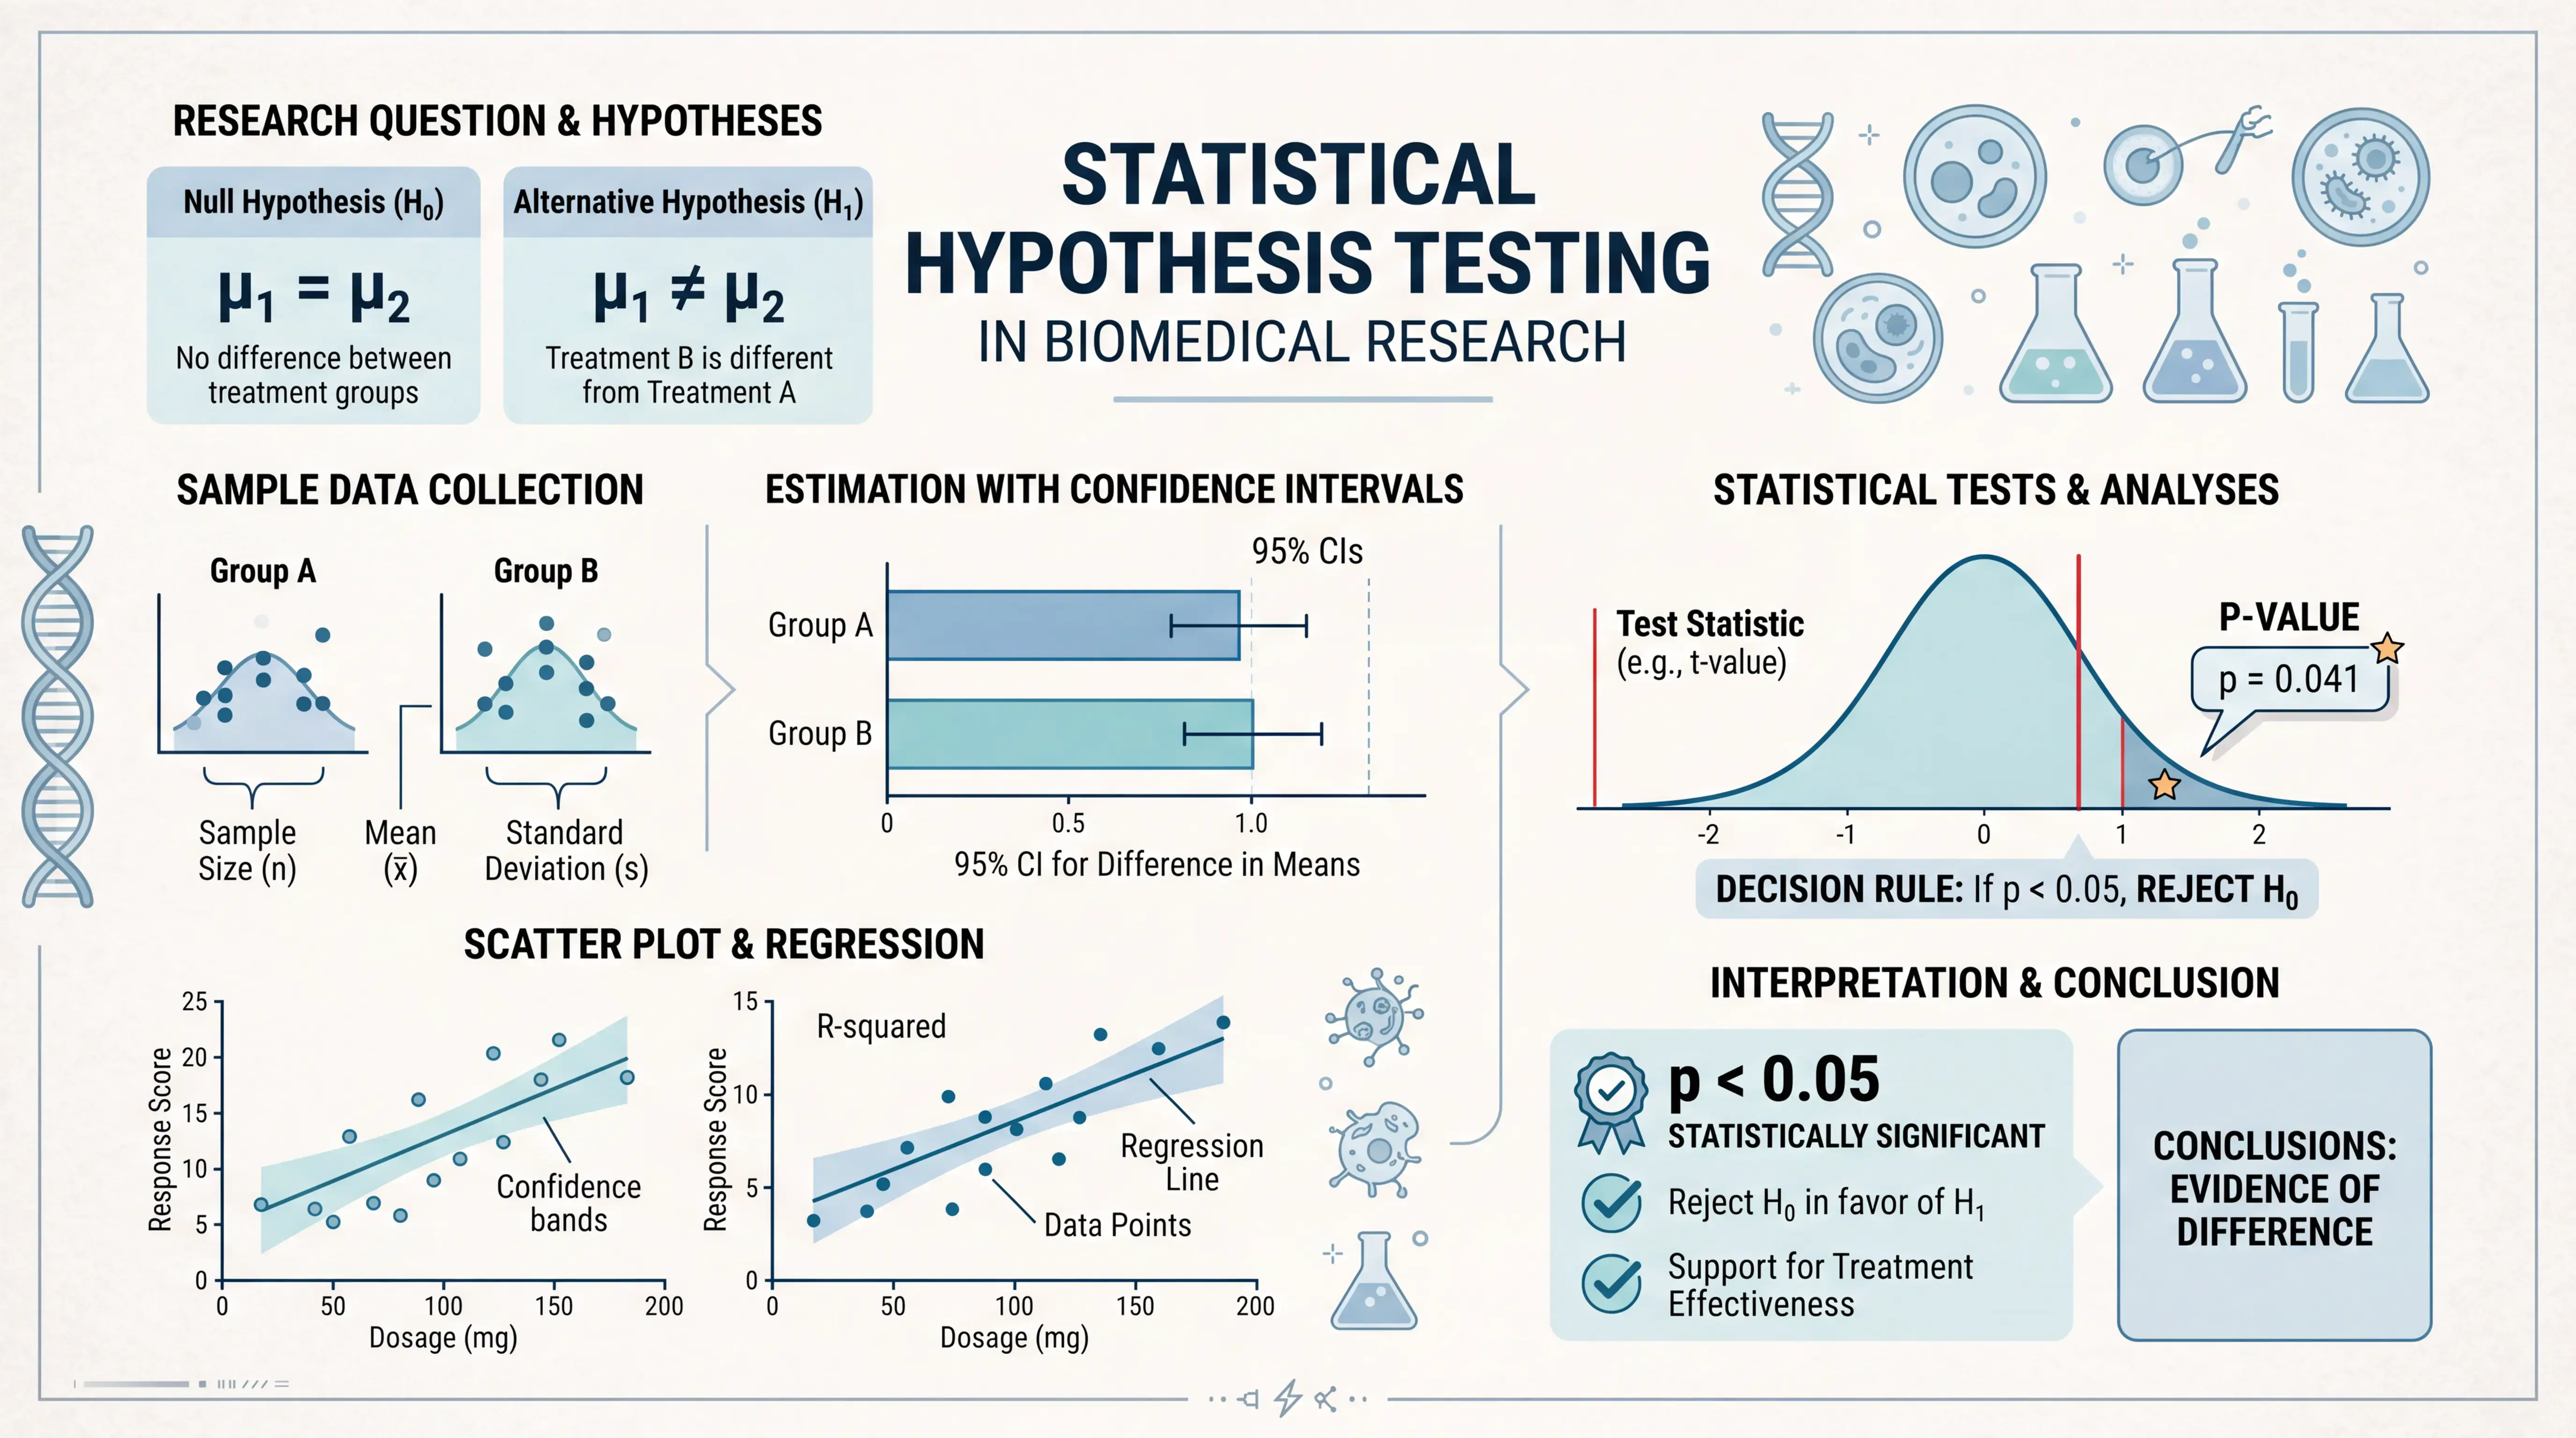
1. Why Statistical Inference Matters
1.1 From Sample to Population
Clinical studies almost never observe the full population. They use a sample and then infer what may be true in the population. That is the core logic of statistical inference.
For example, if a flu drug is tested in 10 patients, the result is only a snapshot. It cannot prove the truth for every patient. It can only help estimate whether the observed difference is likely to reflect a real population effect.
This is why p-values matter. They help us judge whether an observed result is likely to be due to chance alone.
1.2 The Role of the Null Hypothesis
In hypothesis testing, we begin with a null hypothesis. This usually means no difference between groups, no association, or no treatment effect.
In a drug trial, the null hypothesis may state that the new drug does not improve recovery compared with control. If the sample data look unusual under that assumption, we may question the null.
This is not proof in the absolute sense. It is a structured way to test whether the observed pattern is hard to explain by random sampling alone.
2. What a P-Value Actually Means
2.1 The Correct Definition
A p-value is the probability of obtaining the current sample result, or something more extreme, if the null hypothesis were true.
That definition is precise. It is also often misunderstood. A p-value is not the probability that the null hypothesis is true. It is not the probability that the treatment works. It is a probability calculated under a very specific assumption.
A p-value answers this question: if there were truly no difference, how surprising is the result we observed?
2.2 Small Probability, Not Small Effect
A common error is to equate statistical significance with a large or important effect. That is incorrect.
A result can be statistically significant but clinically trivial if the sample is very large. A result can also be clinically meaningful but not statistically significant if the sample is too small or the data are too variable.
So, when reading an essay or manuscript, do not stop at the p-value. Check the effect size, confidence interval, and clinical relevance.
2.3 The 0.05 Threshold
In many studies, a p-value below 0.05 is used as a cutoff. This is a conventional threshold, not a universal law.
If p < 0.05, the observed result is considered unlikely under the null hypothesis, and the null is rejected. If p > 0.05, the data are not strong enough to reject the null.
This does not mean “no difference exists.” It means the sample does not provide enough evidence to conclude that a difference exists.
3. Statistical Significance vs Clinical Meaning
3.1 Why “Significant” Can Mislead
The word “significant” causes confusion. In statistics, it means the result is unlikely under the null hypothesis. It does not mean the result is important, large, or dramatic.
For example, a blood pressure reduction of 1 mmHg may be statistically significant in a very large trial. But clinically, that change may be too small to matter for patient outcomes.
Statistical significance is about evidence. Clinical significance is about impact. They are not the same thing.
3.2 Better Language for Research Writing
When reporting results, say:
- “The difference was statistically significant.”
- “The difference was not statistically significant.”
- “The estimate suggests a possible effect, but the confidence interval is wide.”
Avoid vague wording such as:
- “Very significant”
- “Strongly significant”
- “Proved to be effective”
These phrases are imprecise and often misleading. Good scientific writing is exact, not dramatic.
3.3 A Practical Example
Imagine two groups in a trial. One group has 8 recoveries out of 10, the other has 5 out of 10. The sample looks different.
But whether that difference is statistically significant depends on the test, the sample size, and the variability. In a small study, such a result may still fail to reach significance. In a larger study, a similar proportion difference may be significant.
This is why p-values should always be interpreted in context.
4. How P-Values Are Used in Clinical Research
4.1 Common Tests Behind the Numbers
The p-value comes from statistical tests. The choice of test depends on the type of data:
- t-test for comparing means between two groups
- ANOVA for comparing means across multiple groups
- Chi-square test for categorical data
- Rank-sum test for non-normal continuous data
- Fisher’s exact test for small categorical samples
These tests all ask the same basic question: is the observed difference larger than what random sampling might reasonably produce?
4.2 Report the Right Statistic
In a paper, p-values should not appear alone. They are usually paired with a test statistic:
- t value and p-value
- F value and p-value
- chi-square value and p-value
- rank-sum statistic and p-value
This matters because the statistic shows how the p-value was obtained. It also helps readers judge the analysis properly.
4.3 Understanding “No Statistical Significance”
If a comparison yields p > 0.05, it does not automatically mean the groups are identical. It means the study failed to show evidence of a difference.
That distinction is critical in medicine. A negative result may reflect:
- a truly null effect
- an underpowered study
- large variability
- poor study design
- confounding factors
So, “not statistically significant” is not the same as “proven equal.”
5. Common Mistakes in Reading Research
5.1 Mistaking Sample Data for Population Truth
A frequent error is to look at two sample means and conclude that one group is better. That is not enough. Sampling error can create apparent differences even when the population is the same.
Statistical inference exists to correct for that. It asks whether the observed difference is too large to be explained by chance alone.
5.2 Ignoring Sample Size
Sample size has a major effect on p-values. With a large sample, even very small differences can become statistically significant. With a small sample, even meaningful differences may not reach significance.
This is why modern research should avoid “p-value only” thinking. Always examine effect size and confidence intervals.
5.3 Overinterpreting p < 0.05
A p-value below 0.05 does not prove causality. It does not guarantee reproducibility. It does not remove bias or confounding.
A statistically significant result can still be flawed if the study design is weak. That is why E-E-A-T principles matter in medical writing. Evidence must be interpreted with methodologic caution.
6. How This Helps You Read and Write Better Medical Papers
6.1 A Simple Reading Checklist
When you see a p-value in a clinical paper, ask:
- What is the null hypothesis?
- What test was used?
- Is the sample size adequate?
- What is the effect size?
- Is the result clinically meaningful?
- Could confounding explain the finding?
This checklist helps you avoid shallow conclusions.
6.2 A Better Way to Write Your Results
When writing an essay or manuscript, report the numbers clearly:
- Group means or medians
- Test statistic
- p-value
- Confidence interval
- Clinical interpretation
For example, instead of writing “the treatment was very effective,” write: “The treatment group showed a statistically significant improvement compared with control, but the effect size was modest.”
That style is stronger, more credible, and easier to defend in peer review.
6.3 Why Tools Can Help
Many clinicians understand the concept of p-values but still lose time running analyses, formatting results, or choosing the right test. That is where a research workflow tool can help.
SciFocus.ai can support faster, more structured medical writing and analysis workflows, helping you organize evidence, draft clearer research content, and present statistical results more consistently. For busy students, doctors, and researchers, that saves time and reduces avoidable errors.
7. Conclusion
Why the Concept Matters
Understanding p-values and statistical significance is a basic skill in medical research. It helps you move from raw sample data to defensible conclusions about the population.
Remember the key points. A p-value is the probability of observing the current result, or more extreme data, under the null hypothesis. A p-value below 0.05 suggests the result is unlikely by chance alone. But statistical significance is not the same as clinical importance.
For stronger papers, combine p-values with effect sizes, confidence intervals, and careful interpretation. If you want to streamline that process, consider using scifocus.ai to support your next medical essay or research project.

Did you like this article? Explore a few more related posts.
Start Your Research Journey With Scifocus Today
Create your free Scifocus account today and take your research to the next level. Experience the difference firsthand—your journey to academic excellence starts here.