

Introduction
Sensitivity and specificity are the two core metrics behind every diagnostic essay on test performance. Clinicians use them to judge whether a new assay can detect disease and rule it out reliably. The challenge is that a test can look excellent on one metric and weak on the other. If you misread these numbers, you may overdiagnose healthy patients or miss true disease cases.
1. What sensitivity and specificity really measure
1.1 Sensitivity: the ability to find disease
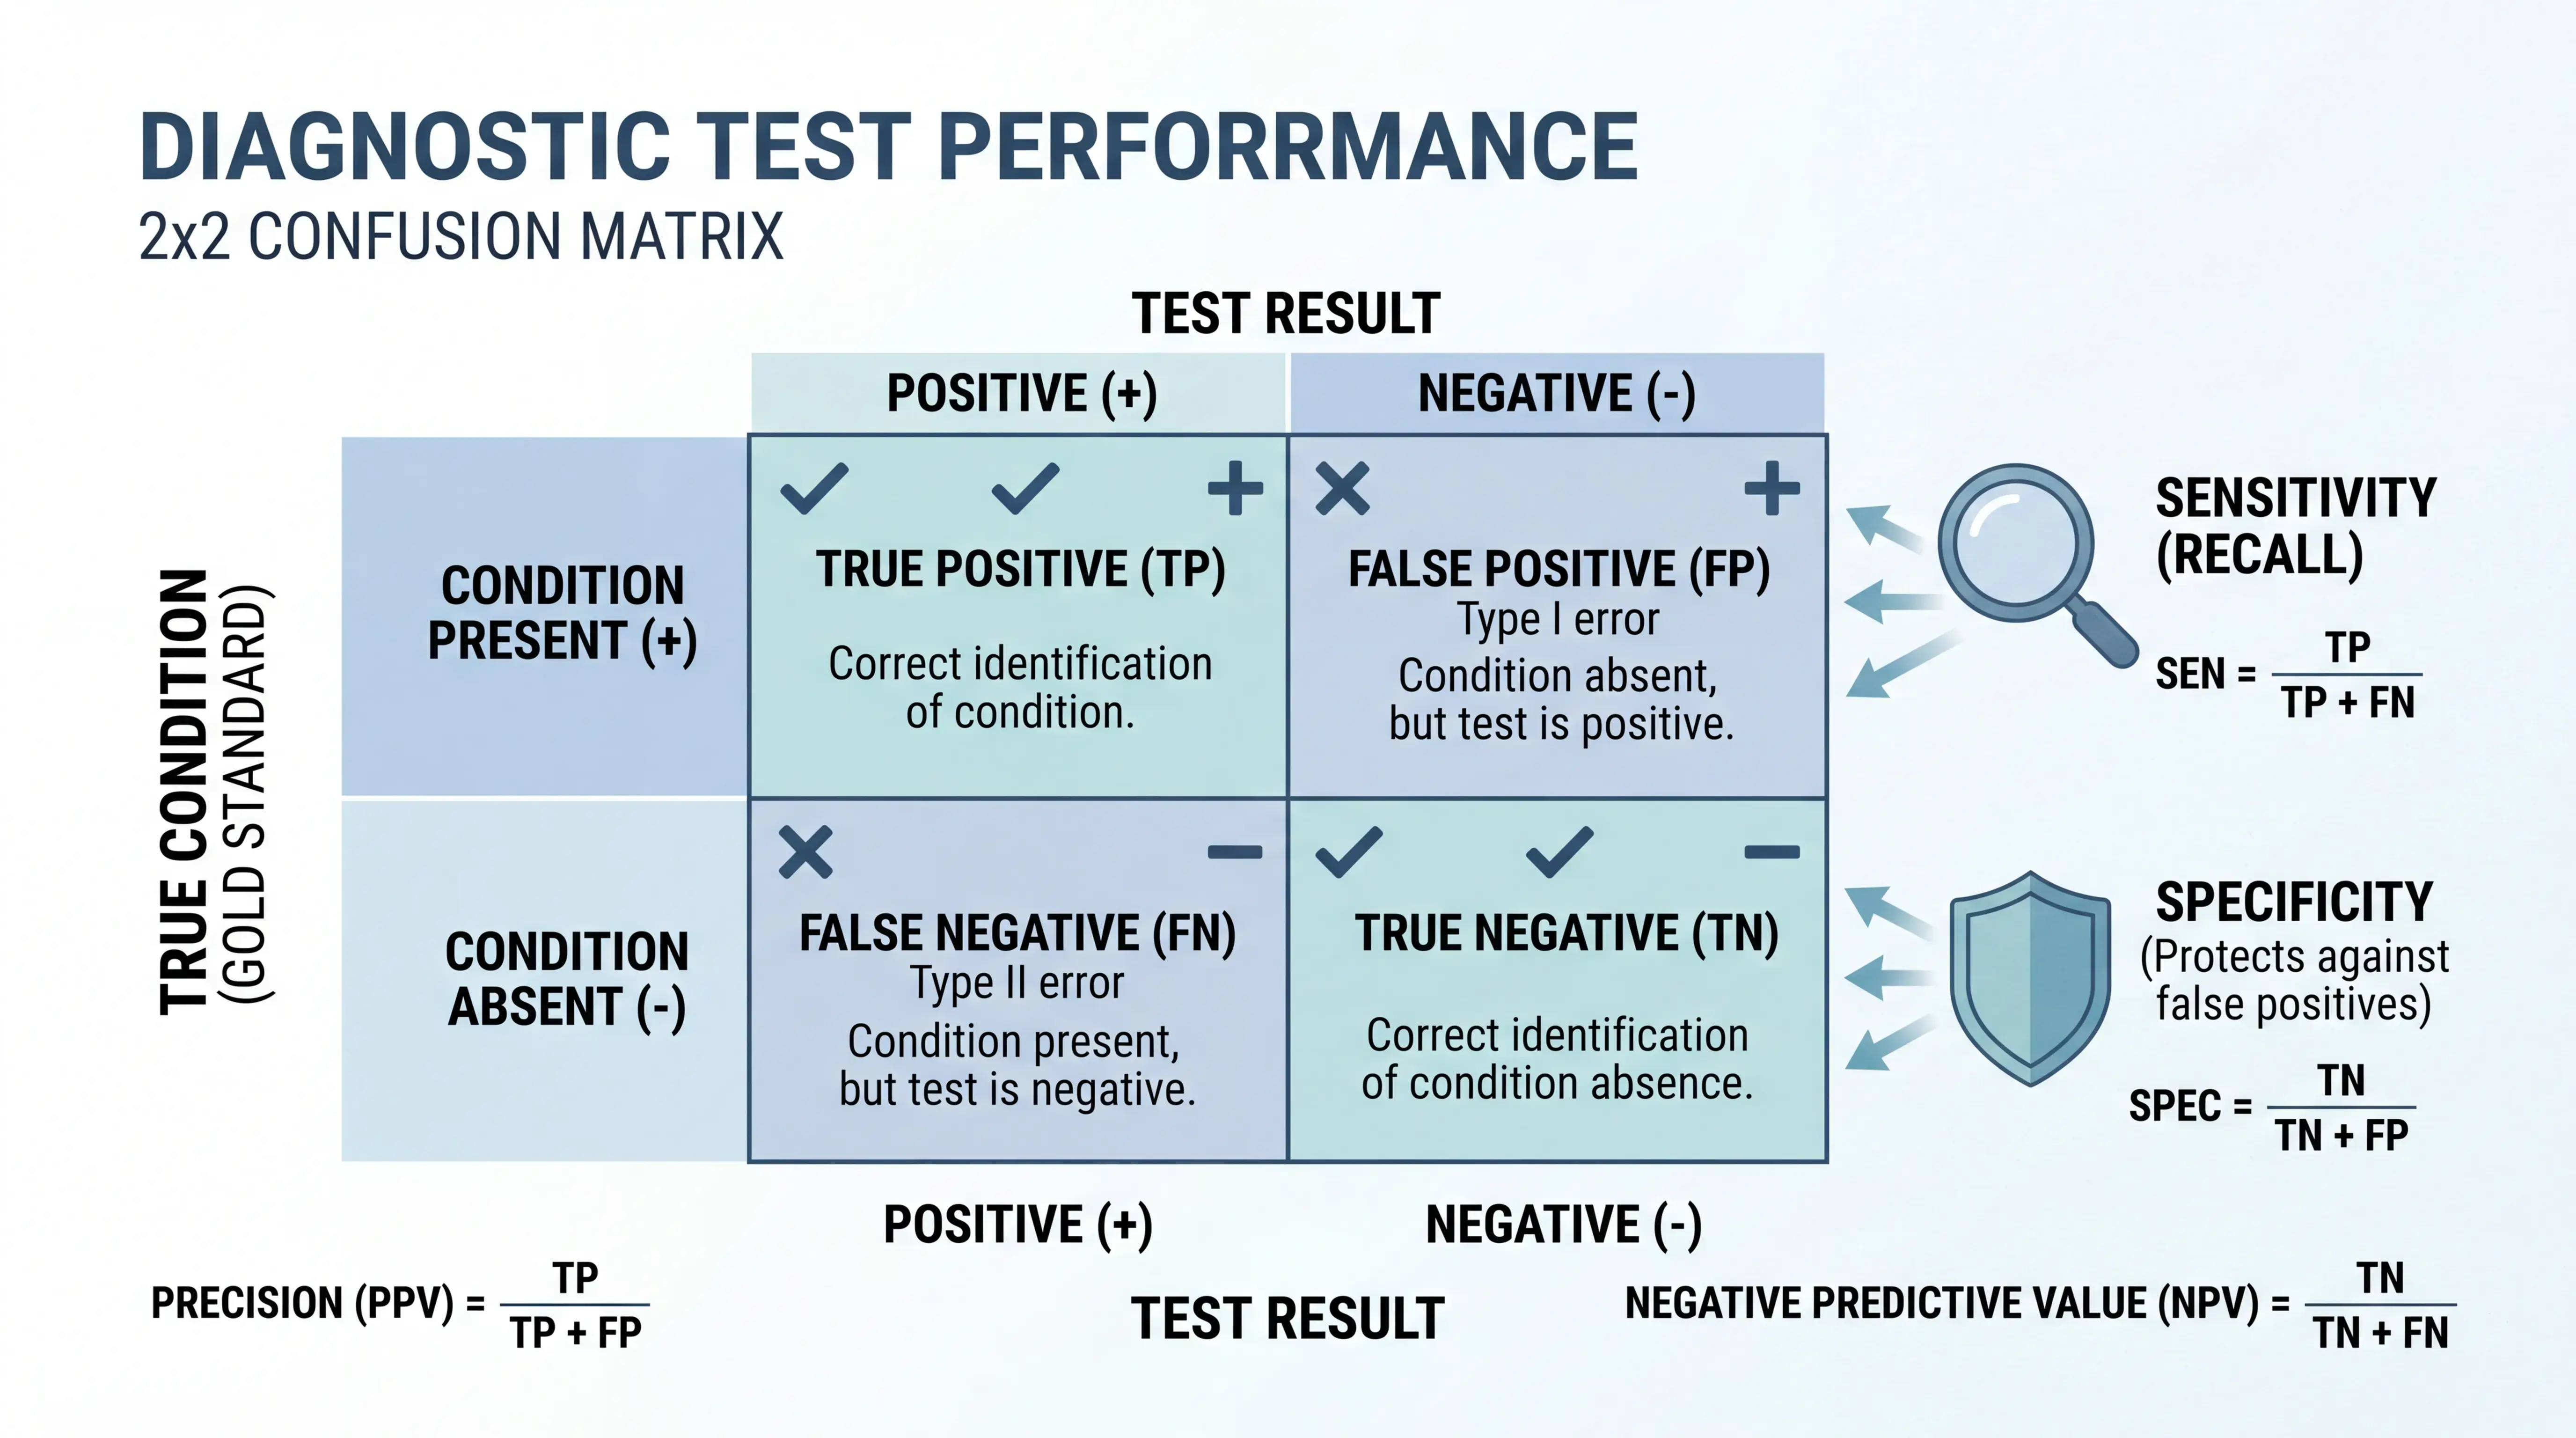
Sensitivity is the proportion of truly diseased patients who test positive. In a 2×2 table, it is calculated as TP / (TP + FN). It answers a simple question: among people who truly have the disease, how many does the test detect?
A test with high sensitivity is useful when missing disease is dangerous. This is why screening tools often prioritize sensitivity. If the disease is serious and early treatment matters, a false negative can be costly.
Sensitivity is about not missing patients who are actually ill.
1.2 Specificity: the ability to exclude disease
Specificity is the proportion of truly non-diseased patients who test negative. Its formula is TN / (TN + FP). It tells you how well the test avoids labeling healthy people as diseased.
A test with high specificity is useful when false positives lead to harm, unnecessary procedures, or high costs. In practice, a confirmatory diagnostic test often needs strong specificity.
Specificity is about correctly reassuring people who do not have the disease.
1.3 The 2×2 table behind the metrics
Diagnostic accuracy is usually organized in a four-cell table:
- TP: true positive
- FP: false positive
- FN: false negative
- TN: true negative
From this table, you can also derive false negative rate as 1 - sensitivity, and false positive rate as 1 - specificity. This structure is the basis for most clinical diagnostic essays and statistical evaluations.
2. Why sensitivity and specificity move in opposite directions
2.1 The cutoff problem
Most tests depend on a threshold, or cutoff. If you lower the cutoff, more people will test positive. That increases sensitivity, but it also increases false positives and lowers specificity.
If you raise the cutoff, fewer people test positive. That increases specificity, but more diseased patients may be missed, so sensitivity falls.
Sensitivity and specificity are usually a trade-off, not two numbers that rise together.
2.2 A practical example
A PCR-based HPV assay may show one performance profile in one cutoff setting and a different profile in another. In the knowledge base example, one test had 80% sensitivity and 90% specificity, while another had 85% sensitivity and 87% specificity. Neither is automatically “better” by one metric alone.
This is why clinical interpretation must match the intended use:
- Screening favors sensitivity
- Confirmation favors specificity
- Risk stratification may require balanced performance
2.3 Why context matters
A diagnostic essay should never treat sensitivity and specificity as abstract theory. The right balance depends on disease severity, prevalence, treatment risk, and downstream consequences.
For example, a highly sensitive test can help identify people who need further workup. But if specificity is poor, the system may be flooded with false alarms. That wastes resources and increases patient anxiety.
3. How to compare diagnostic tests more fairly
3.1 You need more than one number
Sensitivity and specificity are essential, but they do not fully describe diagnostic value. A test can have good sensitivity and mediocre specificity, or the reverse. To compare tests more fairly, clinicians often use additional measures.
Common metrics include:
- Youden index
- Likelihood ratios
- ROC curve and AUC
- Positive and negative predictive values
A single statistic rarely captures the full clinical value of a diagnostic test.
3.2 Youden index: a simple summary
The Youden index is calculated as:
Sensitivity + Specificity - 1
It ranges from 0 to 1. A larger value suggests better overall discrimination between disease and non-disease. In the provided material, two assays had Youden indices of 0.70 and 0.72. On that basis, the second test performed slightly better.
Still, the Youden index is not the only decision tool. Cost, turnaround time, invasiveness, and clinical workflow also matter.
3.3 ROC curve and AUC
For continuous diagnostic variables, ROC analysis is often the best way to evaluate performance. The ROC curve plots:
- Y-axis: sensitivity
- X-axis: 1 - specificity
The AUC reflects discrimination. An AUC of 0.5 means the test performs no better than chance. The larger the AUC above 0.5, the stronger the diagnostic ability.
This is useful when a test has many possible cutoffs. Instead of judging one threshold only, ROC analysis shows the full trade-off between sensitivity and specificity.
4. Choosing the right diagnostic design
4.1 Continuous vs binary data
The evaluation method depends on the type of diagnostic variable.
- Continuous variables: use ROC analysis
- Binary variables: use a 2×2 table directly
- Ordinal variables: choose a strategy based on study design and clinical logic
This distinction is important in real research. A urine protein result with multiple grades can be treated as ordinal or converted into a binary outcome, depending on the analysis plan.
4.2 Why study design changes the interpretation
Diagnostic studies are commonly designed as:
- Cross-sectional studies
- Case-control studies
- Cohort-style screening studies
Cross-sectional designs are common. Case-control designs are feasible, but they may overestimate performance because disease prevalence is artificially separated. That means the results can look stronger than they would in clinical practice.
Study design affects how trustworthy sensitivity and specificity really are.
4.3 The role of prevalence
Predictive values depend on disease prevalence. Sensitivity and specificity do not change much with prevalence, but positive and negative predictive values do.
That means the same test can perform differently in different settings. A test used in a high-risk population may appear more useful than when applied in a low-prevalence population. This is a critical point for translational research and clinical implementation.
5. How clinicians should interpret the balance
5.1 When high sensitivity is preferred
High sensitivity is preferred when the main goal is to avoid missing disease. Examples include screening for serious but treatable conditions. A false negative could delay treatment and worsen outcomes.
Use sensitivity-focused testing when:
- Early detection is vital
- The disease is severe
- Follow-up confirmation is available
5.2 When high specificity is preferred
High specificity is preferred when false positives create harm. This includes invasive procedures, expensive follow-up, or treatments with significant adverse effects.
Use specificity-focused testing when:
- Confirming a diagnosis
- Avoiding unnecessary intervention
- Disease prevalence is low
5.3 The best answer is often a sequence
In practice, many clinical pathways combine tests. One test may screen, and another may confirm. This is more realistic than expecting one assay to do everything.
A well-designed diagnostic pathway can improve both efficiency and safety. It reduces missed cases while also limiting false alarms.
6. A practical workflow for researchers and clinicians
6.1 Step-by-step evaluation
If you are designing or reading a diagnostic study, use this checklist:
- Define the gold standard.
- Build the 2×2 table.
- Calculate sensitivity and specificity.
- Check Youden index or ROC/AUC if the marker is continuous.
- Interpret results in the clinical context.
- Consider prevalence, cost, and workflow.
This approach keeps the analysis rigorous and avoids overclaiming test value.
6.2 How scifocus.ai can help
For medical students, physicians, and researchers, writing a high-quality diagnostic essay takes time. You must summarize evidence, compare metrics, and keep the language precise. scifocus.ai can help you structure the paper, refine the argument, and present diagnostic performance clearly.
It is especially useful when you need to turn raw study data into a polished clinical explanation. That makes it easier to communicate sensitivity, specificity, ROC results, and clinical implications in a professional format.
Conclusion
Sensitivity and specificity are foundational to diagnostic test evaluation. Sensitivity tells you how well a test finds disease. Specificity tells you how well it excludes disease. The right cutoff, study design, and clinical context determine how these numbers should be interpreted. ROC analysis, AUC, and the Youden index provide a more complete view when one metric is not enough. For researchers and clinicians who need to write, summarize, or compare diagnostic evidence efficiently, scifocus.ai can support a faster and more structured workflow.

Did you like this article? Explore a few more related posts.
Start Your Research Journey With Scifocus Today
Create your free Scifocus account today and take your research to the next level. Experience the difference firsthand—your journey to academic excellence starts here.