

Introduction
P value vs confidence interval is one of the most common debates in medical research, yet many papers still report both without explaining what they actually mean. For medical students, clinicians, and researchers, this creates confusion, weakens interpretation, and can lead to overclaiming results. An essay on this topic should clarify not just definitions, but how each measure supports better scientific judgment.

1. Understanding the Core Difference
1.1 What a P value tells you
A P value answers a narrow question. It estimates how compatible your data are with a null hypothesis, assuming that the null is true. In simple terms, it helps researchers judge whether the observed result could plausibly be due to random variation.
A small P value does not prove a treatment works. It only suggests that the data would be unlikely under the null hypothesis. That distinction matters in clinical research, where statistical significance and clinical significance are not the same.
For example, a study may report P < 0.05 and still show only a trivial effect size. In that case, the result is statistically significant, but it may not be meaningful for patient care.
1.2 What a confidence interval tells you
A confidence interval gives a range of plausible values for the effect estimate. It shows both the direction and the precision of the result. A narrow interval suggests more precision. A wide interval suggests uncertainty.
Unlike a single threshold, a confidence interval gives context. It can show whether the effect might be clinically important, not just whether it is statistically detectable.
For researchers, this makes the confidence interval especially valuable in evidence-based medicine. It helps answer a better question: how large is the effect likely to be, and how certain are we?
2. Why Researchers Should Use Both
2.1 P values without context can mislead
A P value alone can encourage a yes-or-no mindset. That is risky in biomedical research. A study with a very large sample may produce a tiny P value even when the effect is small. A small study may fail to reach significance even when the effect is potentially important.
This is why many statistical guidelines now discourage interpreting the P value in isolation. The result of an essay or paper should never rest on a single threshold alone.
Researchers should ask:
- How large is the effect?
- How precise is the estimate?
- Is the finding clinically relevant?
- Could the result change with a larger sample?
2.2 Confidence intervals improve interpretation
Confidence intervals help you see whether the data support a range of possible conclusions. For example, if a risk ratio is 0.80 with a 95% confidence interval of 0.60 to 1.05, the effect could represent a meaningful reduction in risk, but the evidence is not yet definitive.
That is more informative than a simple statement such as “not significant.” It tells the reader what the study can and cannot support.
In clinical writing, this level of precision improves transparency and trust. It also helps readers judge whether the finding is actionable or still uncertain.
3. How to Read Them Together
3.1 Look for agreement, then interpret the size
When the P value and confidence interval point in the same direction, interpretation is easier. If the P value is below 0.05 and the confidence interval does not cross the null value, the evidence supports an association or difference. But the magnitude still matters.
For example, a blood pressure reduction of 1 mmHg may be statistically significant in a large trial, but it may have limited practical impact. A larger reduction with a wider confidence interval may be more clinically interesting, even if the evidence is less precise.
The best reading strategy is simple: significance first, magnitude second, precision always.
3.2 Do not confuse statistical significance with importance
This is one of the most common errors in medical papers. A result can be statistically significant and clinically trivial. It can also be non-significant and still worth further study.
That is why researchers should report effect sizes, confidence intervals, and sample size alongside the P value. Together, these elements make the evidence more balanced.
A good rule is this. If a paper only highlights the P value, the interpretation is incomplete. If it includes confidence intervals, readers can better judge uncertainty and relevance.
4. Common Misinterpretations in Research Writing
4.1 “Not significant” does not mean “no effect”
A non-significant P value does not prove the null hypothesis. It may reflect limited power, measurement error, or a truly small effect. Without the confidence interval, you cannot tell which explanation is more likely.
This matters in early-phase clinical studies, where sample sizes are often modest. A non-significant finding may still justify further research if the confidence interval includes clinically important effects.
4.2 Confidence intervals are not a guarantee of truth
Some authors treat a 95% confidence interval as if it contains the true value with absolute certainty. That is not correct. It is a frequentist method based on repeated sampling. In practice, it means that if the study were repeated many times, 95% of such intervals would contain the true parameter.
Researchers should avoid overstating certainty. Confidence intervals improve understanding, but they are still estimates, not proof.
4.3 The 0.05 cutoff is a convention, not a law
The widespread use of 0.05 creates a false sense of precision. A P value of 0.049 is not fundamentally different from 0.051. The real question is whether the result is robust, precise, and clinically meaningful.
In modern scientific writing, a stronger approach is to report the exact P value and the confidence interval, then explain the effect size in context.
5. Practical Guidance for Medical Students and Clinicians
5.1 When reading a paper
When evaluating a study, use this checklist:
- Identify the effect size.
- Check the confidence interval.
- Review the exact P value.
- Judge clinical relevance.
- Consider sample size and study design.
This approach is more reliable than scanning for “significant” or “non-significant” alone. It also reduces the risk of misreading abstracts, where complex results are often compressed into a few lines.
5.2 When writing your own research
If you are preparing a manuscript, thesis, or clinical report, make sure your results section includes:
- the effect estimate,
- the confidence interval,
- the exact P value,
- and a brief interpretation.
This is especially important in an essay or research summary aimed at an academic audience. Clear statistical reporting improves credibility and makes your paper easier to review.
If possible, tie the numbers back to the clinical question. For example, explain whether the observed effect would matter in treatment decisions, guideline development, or future trials.
6. Why Better Statistical Reporting Improves Research Quality
6.1 It supports reproducibility
Clear statistical reporting helps other researchers evaluate your methods and compare your findings with existing evidence. That is essential for meta-analysis, systematic review, and guideline development.
When studies report only P values, important details are lost. Confidence intervals preserve more information about uncertainty and effect size.
6.2 It improves decision-making in medicine
Clinical decisions are rarely based on a single number. Doctors need to know how strong the evidence is, how large the benefit may be, and how much uncertainty remains.
That is why the p-value vs confidence interval discussion is not just statistical. It is directly tied to patient care. Better reporting leads to better interpretation, and better interpretation supports better medicine.
Conclusion
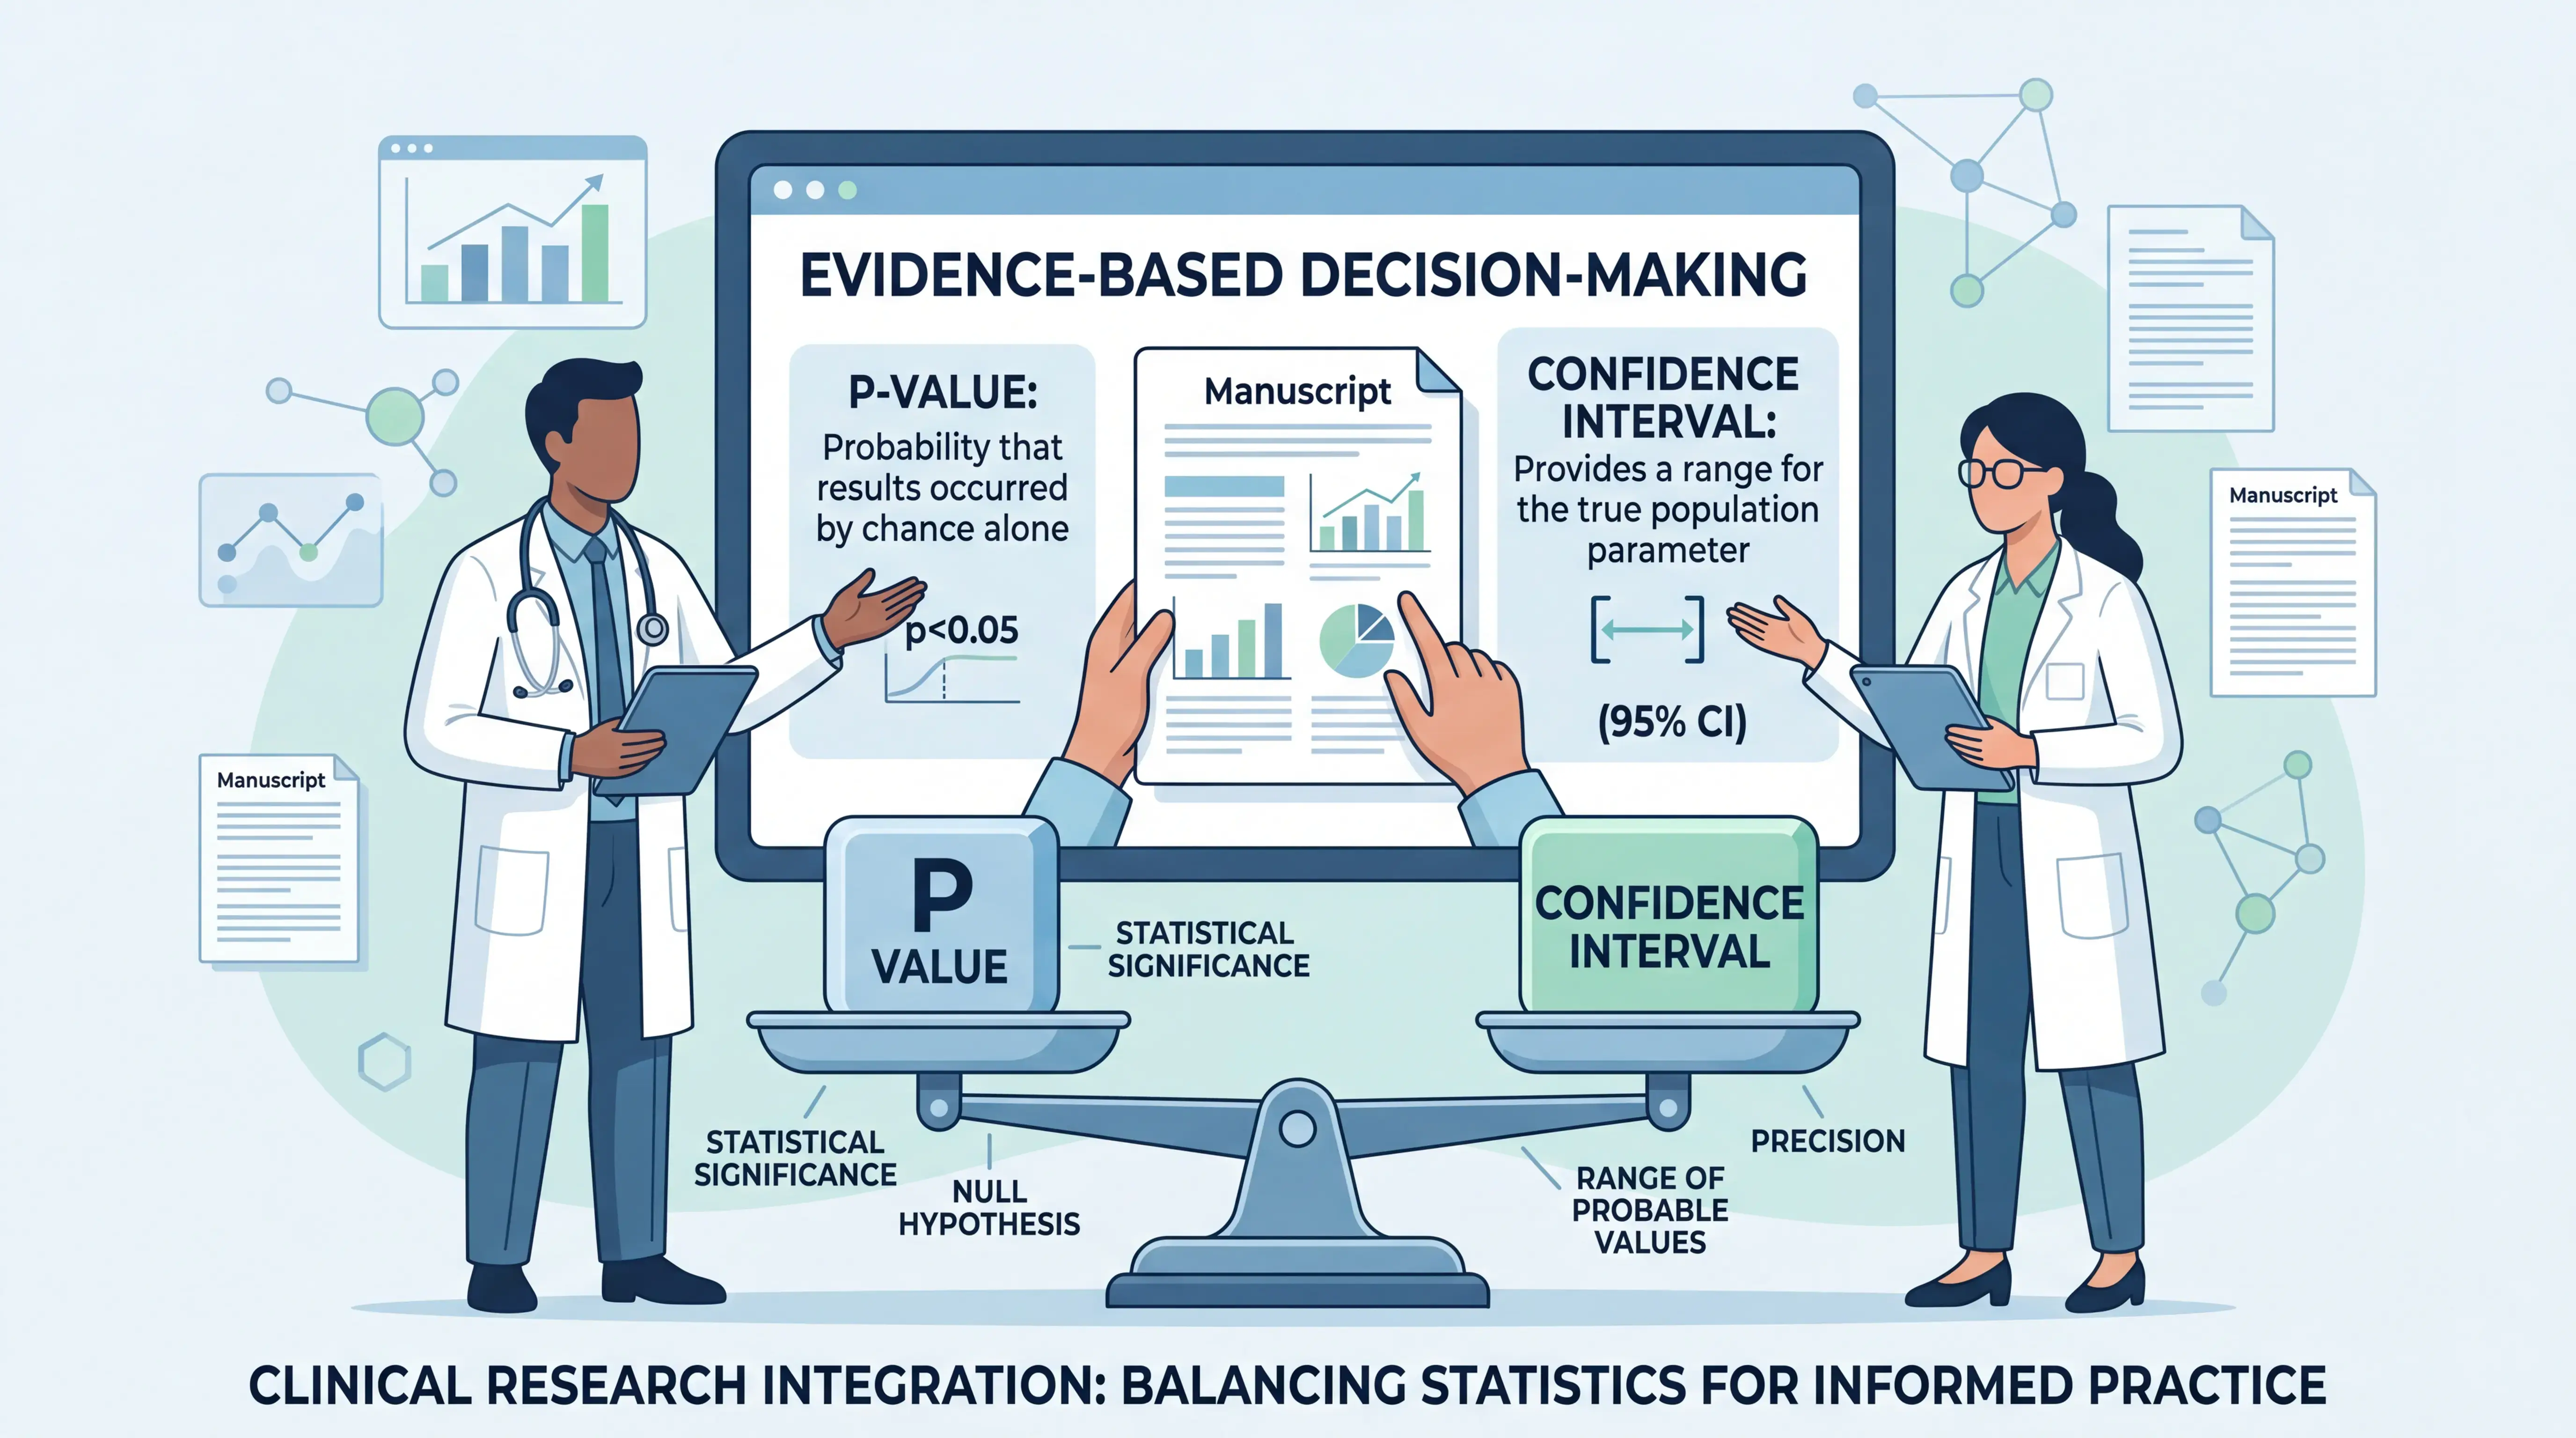
The key difference between p-value vs confidence interval is simple but important. A P value tests compatibility with a null hypothesis. A confidence interval shows the likely range of the effect and its precision. Used together, they give a fuller and more honest picture of the evidence.
For medical students, clinicians, and researchers, the goal is not to choose one and ignore the other. The goal is to interpret both correctly, in context, and with clinical relevance in mind. If you want to write clearer, more rigorous research summaries and save time on statistical interpretation, tools like scifocus.ai can help structure your essay, sharpen your analysis, and improve the quality of your academic writing.
Did you like this article? Explore a few more related posts.
Start Your Research Journey With Scifocus Today
Create your free Scifocus account today and take your research to the next level. Experience the difference firsthand—your journey to academic excellence starts here.