

How to Report Western Blot and Flow Cytometry Data
Introduction
Reporting essay-level scientific results is not enough. In biomedical research, weak presentation of Western blot and flow cytometry data can undermine an otherwise strong study. Readers want clarity, reproducibility, and proper quantification. Reviewers want evidence that gating, controls, and normalization were done correctly. If your data are hard to read, they are hard to trust.

1. Understand What Each Method Must Prove
1.1 Western blot is for protein expression
Western blot, or protein immunoblotting, is used to detect a specific protein after electrophoretic separation and transfer to a membrane such as NC or PVDF. Its main purpose is to show whether a target protein is present, reduced, increased, or modified.
A strong Western blot report should make the target, loading control, and experimental comparison immediately clear. That means the reader should know what protein was tested, which samples were compared, and how the signal was normalized.
1.2 Flow cytometry is for population-level measurement
Flow cytometry measures fluorescence in individual cells. It is commonly used to identify immune cell subsets, such as CD3+ T cells, CD4+ T cells, or CD8+ T cells. It depends on correct voltage settings, compensation, and gating.
A strong flow cytometry report should show how cells were gated and how positive populations were defined. Without this, percentages and scatter plots are not convincing.
2. Report Western Blot Data Correctly
2.1 Describe the experimental workflow briefly but precisely
A clear methods description should include protein extraction, gel electrophoresis, membrane transfer, blocking, antibody incubation, and detection. In most lab workflows, protein is extracted from cells or tissues after lysis at low temperature, then separated by PAGE, transferred to a membrane, and visualized through antibody-linked fluorescence or HRP-based chemiluminescence.
Include the essentials:
- sample source, such as cells or tissue
- lysis buffer or extraction method
- gel system and transfer membrane
- primary and secondary antibodies
- detection system
- software used for quantification
Do not overexplain routine steps, but never skip the details that affect interpretation.
2.2 Present bands with clear normalization
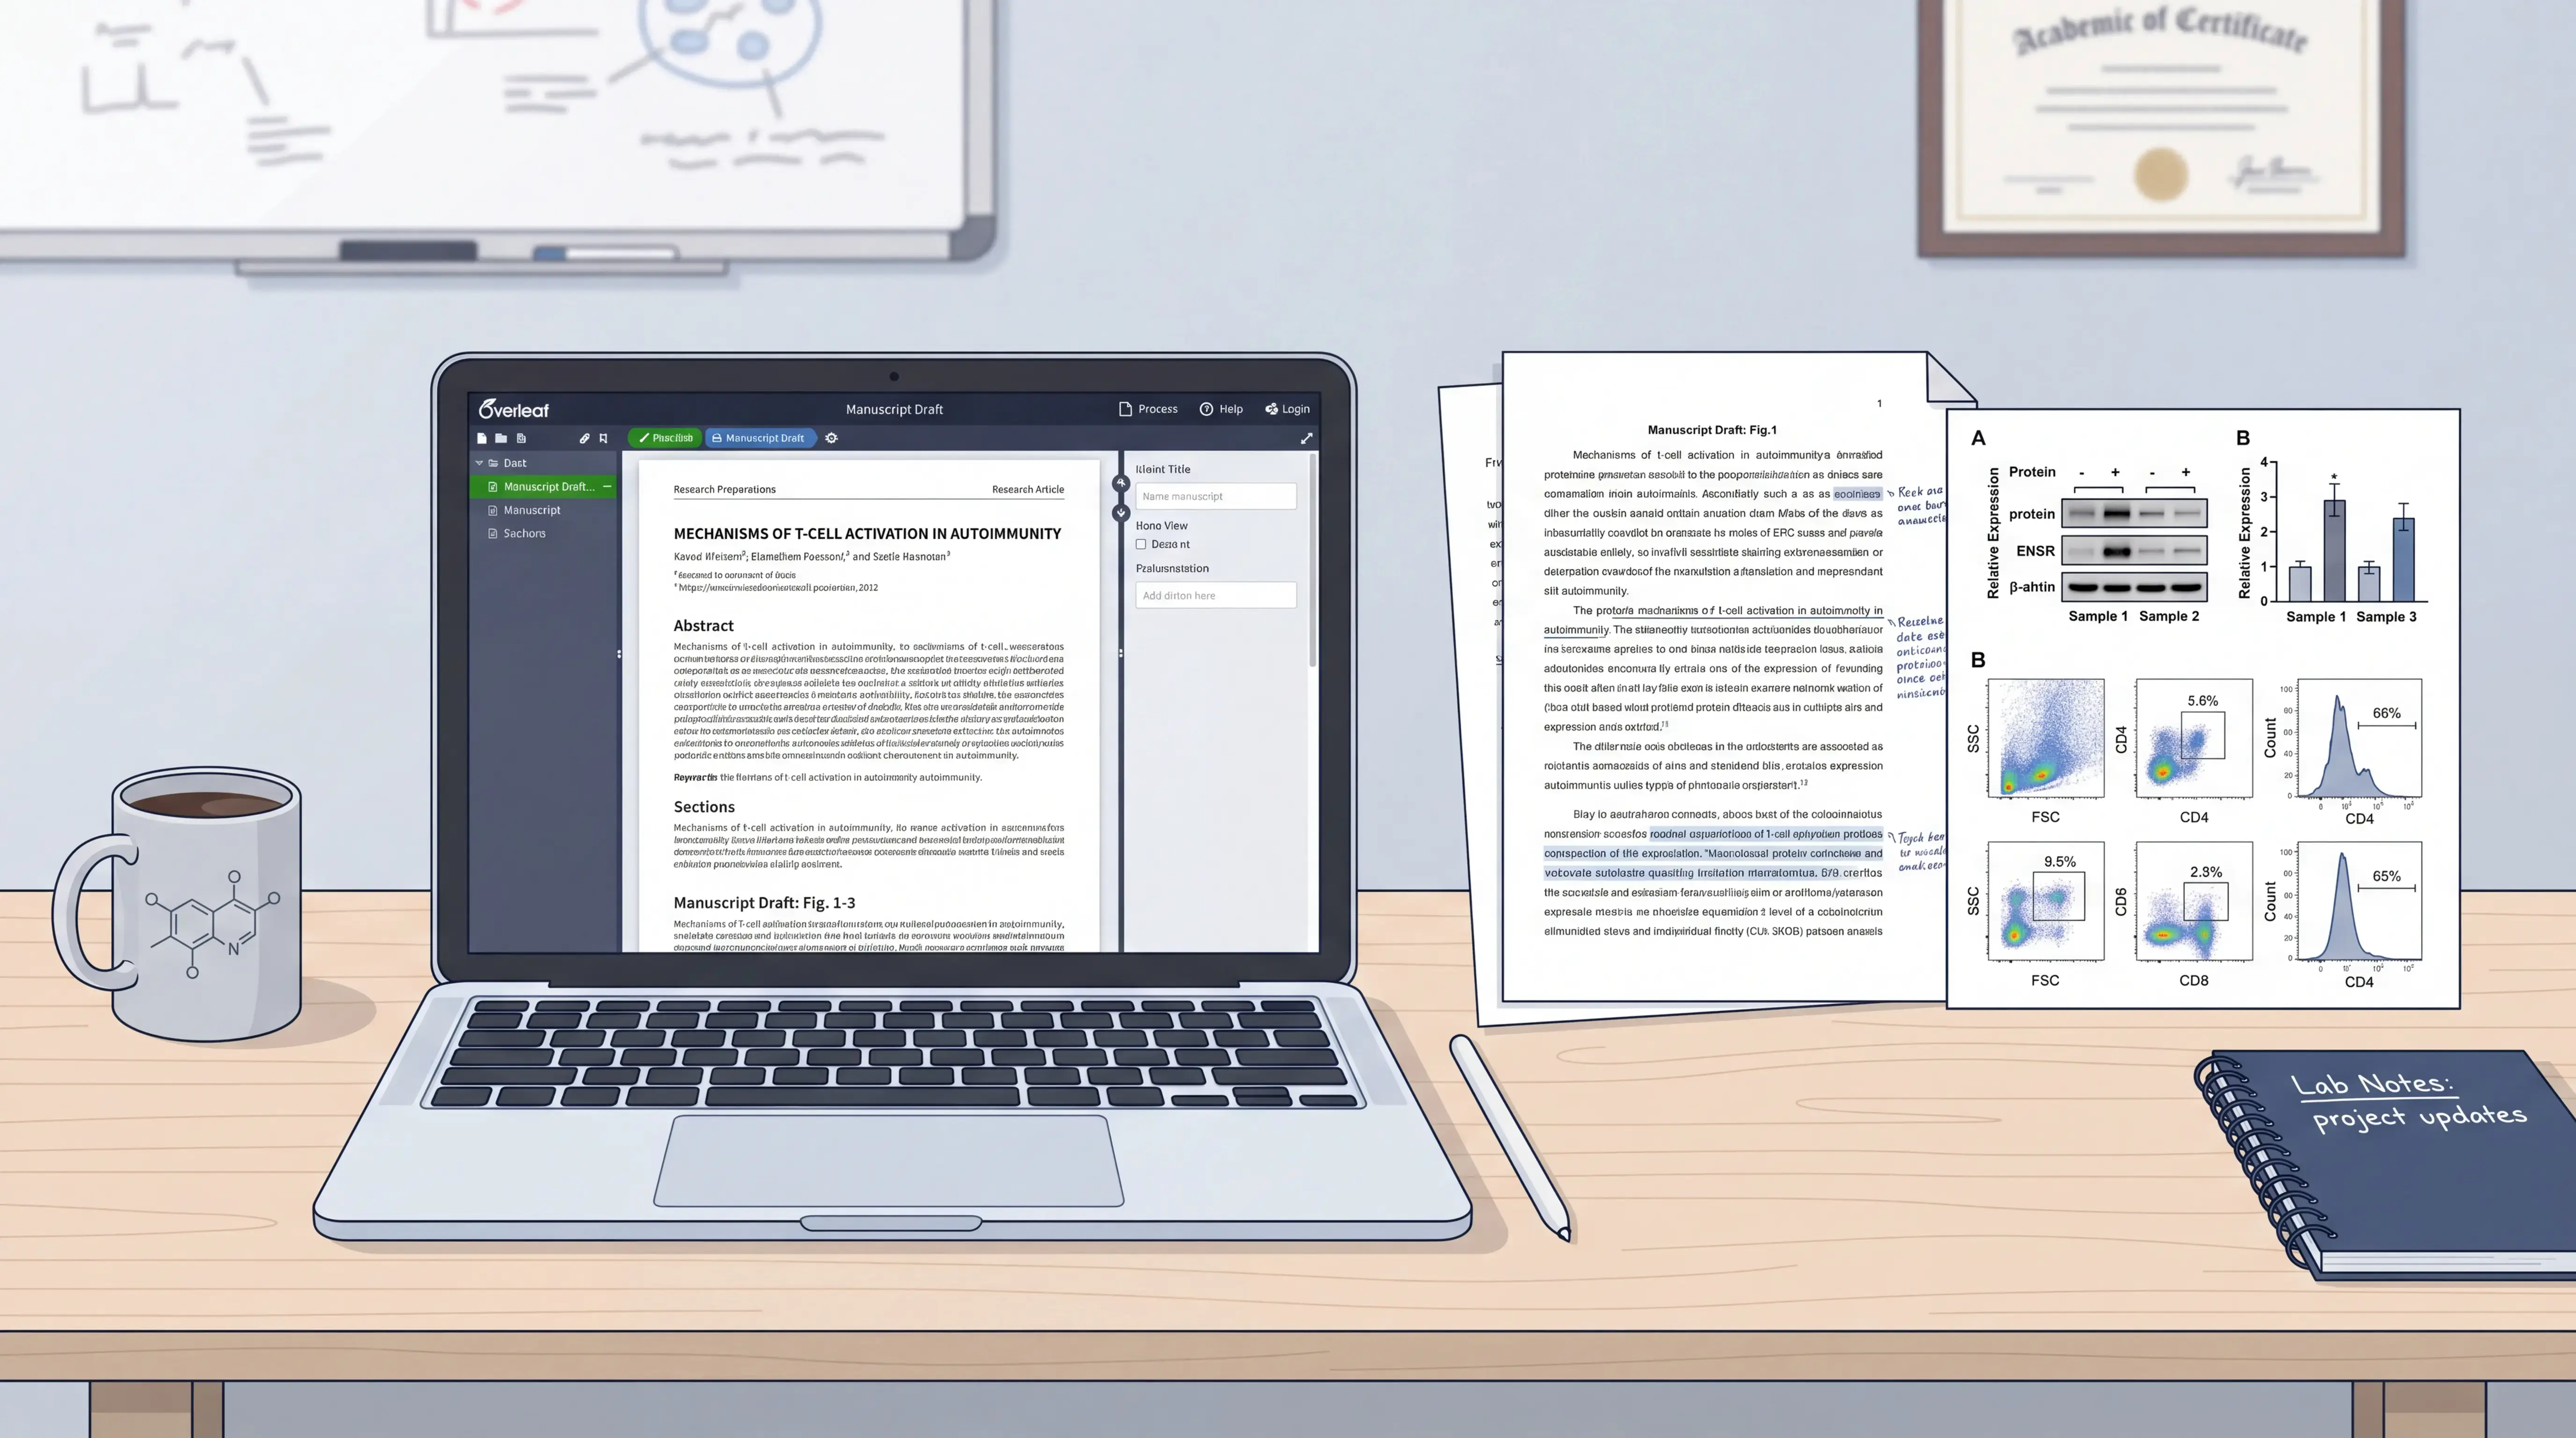
Western blot bands should be shown with the target protein and a loading control, such as GAPDH, β-actin, or tubulin, when appropriate. The key question is whether the target band changes after normalization.
If you quantify bands with ImageJ, report:
- how the image was acquired,
- whether background subtraction was performed,
- what measurement was used, such as integrated density,
- how the target signal was normalized,
- what statistical test was applied.
For example, a typical report may state that band intensity was measured in ImageJ after background subtraction, then normalized to the loading control before comparison between groups.
Relative density should be calculated from the normalized target signal, not from raw band brightness alone.
2.3 Keep the image honest
Do not crop away important lanes without explanation. Do not adjust contrast in a way that distorts band intensity. If the blot is rotated or uneven, correct only for presentation, not to change the data.
Good practice includes:
- showing the full or relevant uncropped blot in supplementary material
- marking molecular weight where needed
- labeling every lane clearly
- keeping exposure consistent within the same experiment
If the image looks manipulated, the data lose credibility immediately.
3. Report Flow Cytometry Data Correctly
3.1 Start with instrument setup
Flow cytometry reporting should begin with the instrument and acquisition settings. In workflows such as Beckman CytoFLEX, researchers first check sheath fluid and waste, start the instrument, create a new experiment, and assign channels to the corresponding markers.
Important reporting elements include:
- instrument model
- software version, if available
- fluorescence channels used
- voltage settings
- compensation approach
- acquisition speed and event count
These details matter because small differences in setup can shift fluorescence signals and alter interpretation.
3.2 Explain gating in a logical sequence
Gating is the backbone of flow cytometry analysis. Readers should be able to follow the path from total events to the final positive population.
A clear sequence might look like this:
- exclude debris by FSC and SSC,
- exclude doublets if needed,
- gate on the parent population,
- define marker-positive cells using blank or unstained controls,
- report the final subset as a percentage of the parent gate.
For example, if you are analyzing T cells, you may first gate CD3+ cells, then identify CD8+ or CD4+ populations. The gating strategy should match the biological question.
Never present only the final percentage if the gating path is missing.
3.3 Report compensation and controls
Compensation is necessary when fluorophores overlap. Single-stained controls should be used to correct spillover between channels. Blank or unstained samples help define negative populations and set thresholds.
Your report should state whether you used:
- unstained control
- single-stained control
- fluorescence minus one, if applicable
- compensation matrix or software-based correction
If compensation is poor, false positives can appear. That is a technical failure, not a biological discovery.
4. Write Results That Readers Can Trust
4.1 Use numbers, not vague claims
Avoid phrases like “obviously increased” or “much stronger” unless you support them with data. Instead, state the measured result, the comparison group, and the statistical outcome.
A stronger Results sentence looks like this:
- “Normalized target protein expression increased by 1.8-fold compared with control.”
- “The CD4+ population accounted for 32.4% of CD3+ cells after gating.”
Scientific writing becomes stronger when every claim can be traced to a number.
4.2 Match the figure to the text
The figure legend should tell the reader exactly what is shown. For Western blot, list the protein, loading control, and quantification method. For flow cytometry, list the gating scheme, cell population, and control type.
A good legend answers:
- what was measured
- how it was measured
- how many replicates were included
- what statistic was used
- what the error bars represent
4.3 Keep the data presentation consistent
Use the same naming style across figures, legends, and methods. If you call a marker CD4 in one section, do not switch to “T helper marker” in another unless you define it clearly. Consistency reduces confusion and improves review outcomes.
Consistency is not cosmetic. It is part of scientific reliability.
5. Common Mistakes to Avoid
5.1 Western blot mistakes
Common errors include overexposed bands, missing loading controls, unclear lane labels, and weak quantification. Another frequent problem is reporting only the blot image without any numerical analysis.
Avoid these pitfalls:
- no background correction
- no normalization
- no replicate information
- no statistical test
- no full image access
5.2 Flow cytometry mistakes
Common flow cytometry errors include unclear gates, missing compensation, inconsistent thresholds, and reporting percentages without parent population context. Another issue is using controls incorrectly.
Avoid these pitfalls:
- gating without explanation
- using one sample to define all cutoffs
- omitting instrument settings
- failing to report event numbers
- not saving the analysis workflow
If the reader cannot reproduce your analysis, the reporting is incomplete.
6. Use a Workflow That Reduces Reporting Errors
6.1 Standardize analysis from the start
The easiest way to report Western blot and flow cytometry data well is to standardize the workflow before analysis begins. That means naming files clearly, saving raw data, recording settings, and keeping a fixed structure for figures and legends.
A practical workflow includes:
- raw data storage
- consistent sample naming
- preset analysis templates
- replicate tracking
- final QC check before writing
6.2 Use tools that support documentation
Software such as ImageJ can help quantify Western blot bands through grayscale and density analysis. For flow cytometry, instrument software can help set channels, adjust voltage, run compensation, and build plots. But software alone does not solve reporting problems.
This is where platforms like scifocus.ai can help researchers organize notes, standardize figure descriptions, and streamline manuscript drafting. A structured workflow saves time and reduces reporting gaps before submission.
Conclusion
To report Western blot and flow cytometry data well, focus on three things: clear methods, honest images, and reproducible analysis. For Western blot, show the target band, loading control, normalization, and quantification. For flow cytometry, explain the instrument settings, controls, compensation, and gating path. Strong reporting is not about adding more words. It is about making every result easy to verify.
If you want to write faster without losing rigor, support your manuscript workflow with scifocus.ai. It can help you organize research content, improve structure, and turn raw experimental notes into cleaner scientific writing.
Did you like this article? Explore a few more related posts.
Start Your Research Journey With Scifocus Today
Create your free Scifocus account today and take your research to the next level. Experience the difference firsthand—your journey to academic excellence starts here.