

How to Present Error Bars Correctly in Scientific Figures
Introduction
Many medical students, clinicians, and researchers know the feeling. A figure looks “fine” at first glance, yet reviewers still question the statistics, labels, or error bars. In a scientific essay, these small visual details can decide whether your data feels credible or careless. How to present error bars correctly in scientific figures is not only a design issue. It is a reporting issue. Clear error bars improve readability, support interpretation, and reduce revision requests.
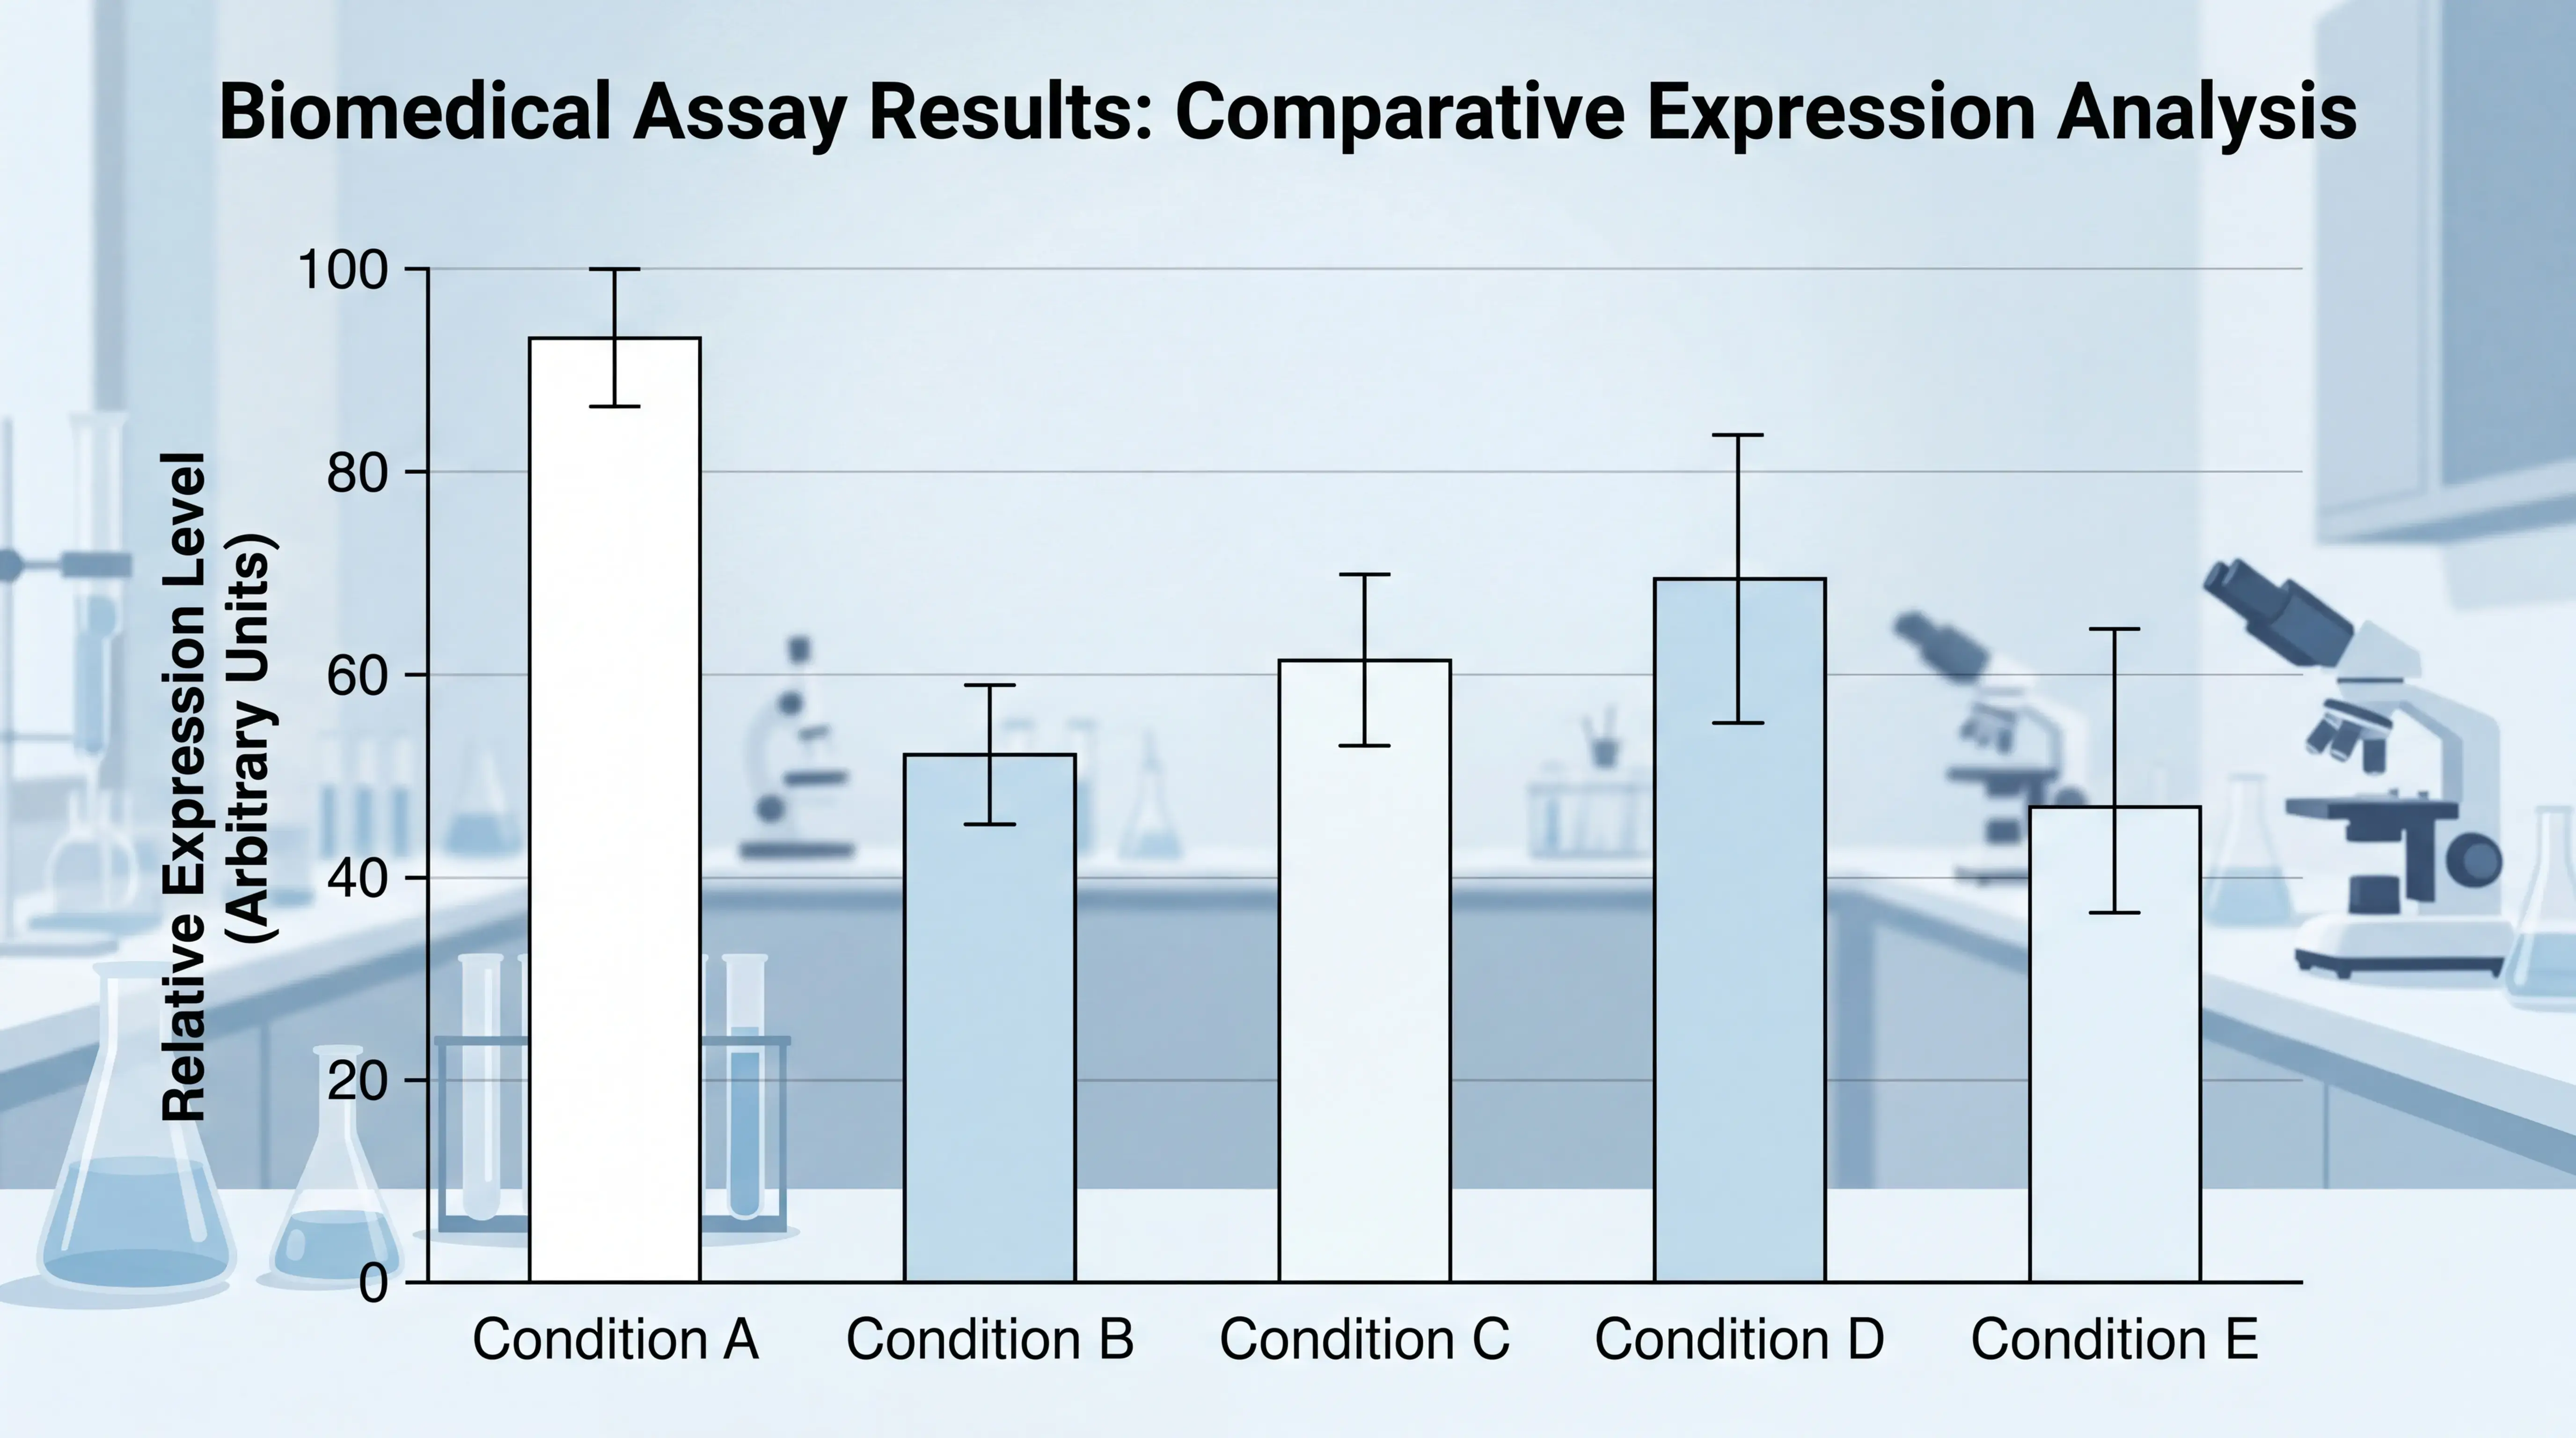
1. Why Error Bars Matter in Scientific Figures
1.1 They show variability, not decoration
Error bars are not ornamental. They communicate spread, uncertainty, or precision. In most biomedical papers, they represent standard deviation, standard error, or confidence intervals. If readers cannot tell what the bars mean, the figure loses value.
A figure with unclear error bars can mislead even when the experiment is valid. That is why the legend must define them clearly.
1.2 They help readers judge the strength of the result
Researchers often scan figures before reading the full text. Well-presented error bars help them see whether groups overlap, whether variation is large, and whether the result looks stable. Poor presentation forces the reader to guess.
This is especially important in clinical and laboratory studies, where quantitative differences are often subtle. A clean figure reduces friction and improves trust.
2. Choose the Right Type of Error Bar
2.1 Match the error bar to the question
Not every dataset should use the same error bar. The choice depends on the message you want to communicate.
Common options include:
- Standard deviation, for data dispersion
- Standard error, for precision around the mean
- Confidence interval, for estimated range and inferential clarity
If the paper is about biological variation, SD may be appropriate. If it is about the estimate of a mean, SE or a confidence interval may be better. Do not use an error bar type you cannot explain.
2.2 State it in the figure legend
A figure legend should make the method obvious. For example, write “Data are mean ± SD” or “Bars represent mean with 95% CI.” This is standard practice in scientific writing and prevents confusion.
If you omit this, readers may interpret the plot incorrectly. That weakens both the figure and the essay supporting it.
3. Use Consistent Formatting Across the Figure
3.1 Keep font sizes and axis labels uniform
One common error is inconsistent typography. X-axis labels and Y-axis titles should use the same font family and size whenever possible. If one label looks larger than the other, the figure feels unbalanced.
Consistency signals care. Inconsistency signals haste. This matters in journal submission because reviewers notice these details quickly.
3.2 Avoid overcrowded axis titles
Long axis titles are a frequent problem in biomedical figures. If the title is too long, do not shrink one label dramatically while leaving another oversized. Instead, use line breaks or shorten the wording while keeping the meaning accurate.
For example, if the Y-axis title includes “percentage,” add the percent sign in parentheses when appropriate. Then break the title into two lines if needed. This is cleaner and easier to read.
4. Report the Data Correctly Behind the Bars
4.1 Do not leave bar values missing
A serious problem is showing bars without values that should logically be present. If one group has no detectable signal, the bar should still be shown as zero when that is the correct statistical representation. Missing bars create uncertainty.
Every visible gap should be intentional, not accidental.
In biomedical figures, readers expect the plotted statistics to match the text. If the results section says no signal was detected, the figure must reflect that outcome clearly.
4.2 Align the plotted values with the analysis
The figure should match the statistical test used. If you compare categorical outcomes, a Fisher exact test may be suitable. If you compare continuous measurements, a t test or another parametric or nonparametric method may be more appropriate, depending on the data.
The key point is simple. The graph, the legend, and the statistical method must tell the same story. If they do not, reviewers will question the analysis.
5. Present Figures in the Order Readers Expect
5.1 Follow the logic of the biology
Scientific figures should be arranged according to experimental or pathological logic. Readers usually expect a progression from control to disease stage, or from baseline to advanced condition. If the layout reverses that order, the figure becomes harder to understand.
For example, a control group should not be placed in a visually awkward position just because its signal is low. Layout should serve comprehension first.
5.2 Keep panels symmetrical when possible
Asymmetrical panel design looks unfinished. If several groups are shown with two panels plus an inset, but one control group is shown with only one panel, the whole figure may look uneven.
A better approach is to standardize panel structure across groups. Use the same visual logic for all conditions. This creates a more professional result and makes the figure easier to scan.
6. Make the Statistical Story Easy to Read
6.1 Show significance clearly, but not aggressively
If a figure uses a bracket or brace to connect multiple groups, the annotation must be precise. A single asterisk should match the comparison being claimed. If the analysis compares multiple groups against one control, the labeling should make that clear.
Do not let the visual marker imply one comparison while the statistics support another. That is a common source of reviewer concern.
6.2 Use the correct test and explain it
When sample sizes are small or the variables are categorical, Fisher exact test can be appropriate. It tests association in a contingency table and is often used when data are limited. In contrast, continuous outcome data may require different methods.
The correct test is not the one that looks most familiar. It is the one that fits the data. If the study design is unclear, the figure cannot carry the statistical message on its own.
7. Practical Checklist Before Submission
7.1 Check the figure like a reviewer
Before submission, ask these questions:
- Are the error bars defined in the legend?
- Do the bars represent SD, SE, or CI correctly?
- Are font sizes consistent?
- Are axis labels readable and aligned?
- Do zero or missing values reflect the true data?
- Does the layout match the biological sequence?
- Does the statistical annotation match the test used?
If any answer is unclear, revise the figure.
7.2 Export at journal-quality resolution
Low-resolution figures can blur error bars and make axis text unreadable. Export at sufficient resolution and use clean vector graphics when possible. This is especially important for bar charts, Western blot layouts, and multi-panel figures.
A polished figure does more than look good. It helps the paper survive peer review.
8. A Smarter Workflow for Researchers
8.1 Save time by standardizing figure creation
Many researchers lose time fixing the same figure problems again and again. Inconsistent fonts, missing labels, and poorly placed error bars are common because figure preparation is often rushed.
A structured workflow solves this. Use a repeatable template, define plotting rules early, and check each panel against the manuscript text.
8.2 Use tools that reduce formatting errors
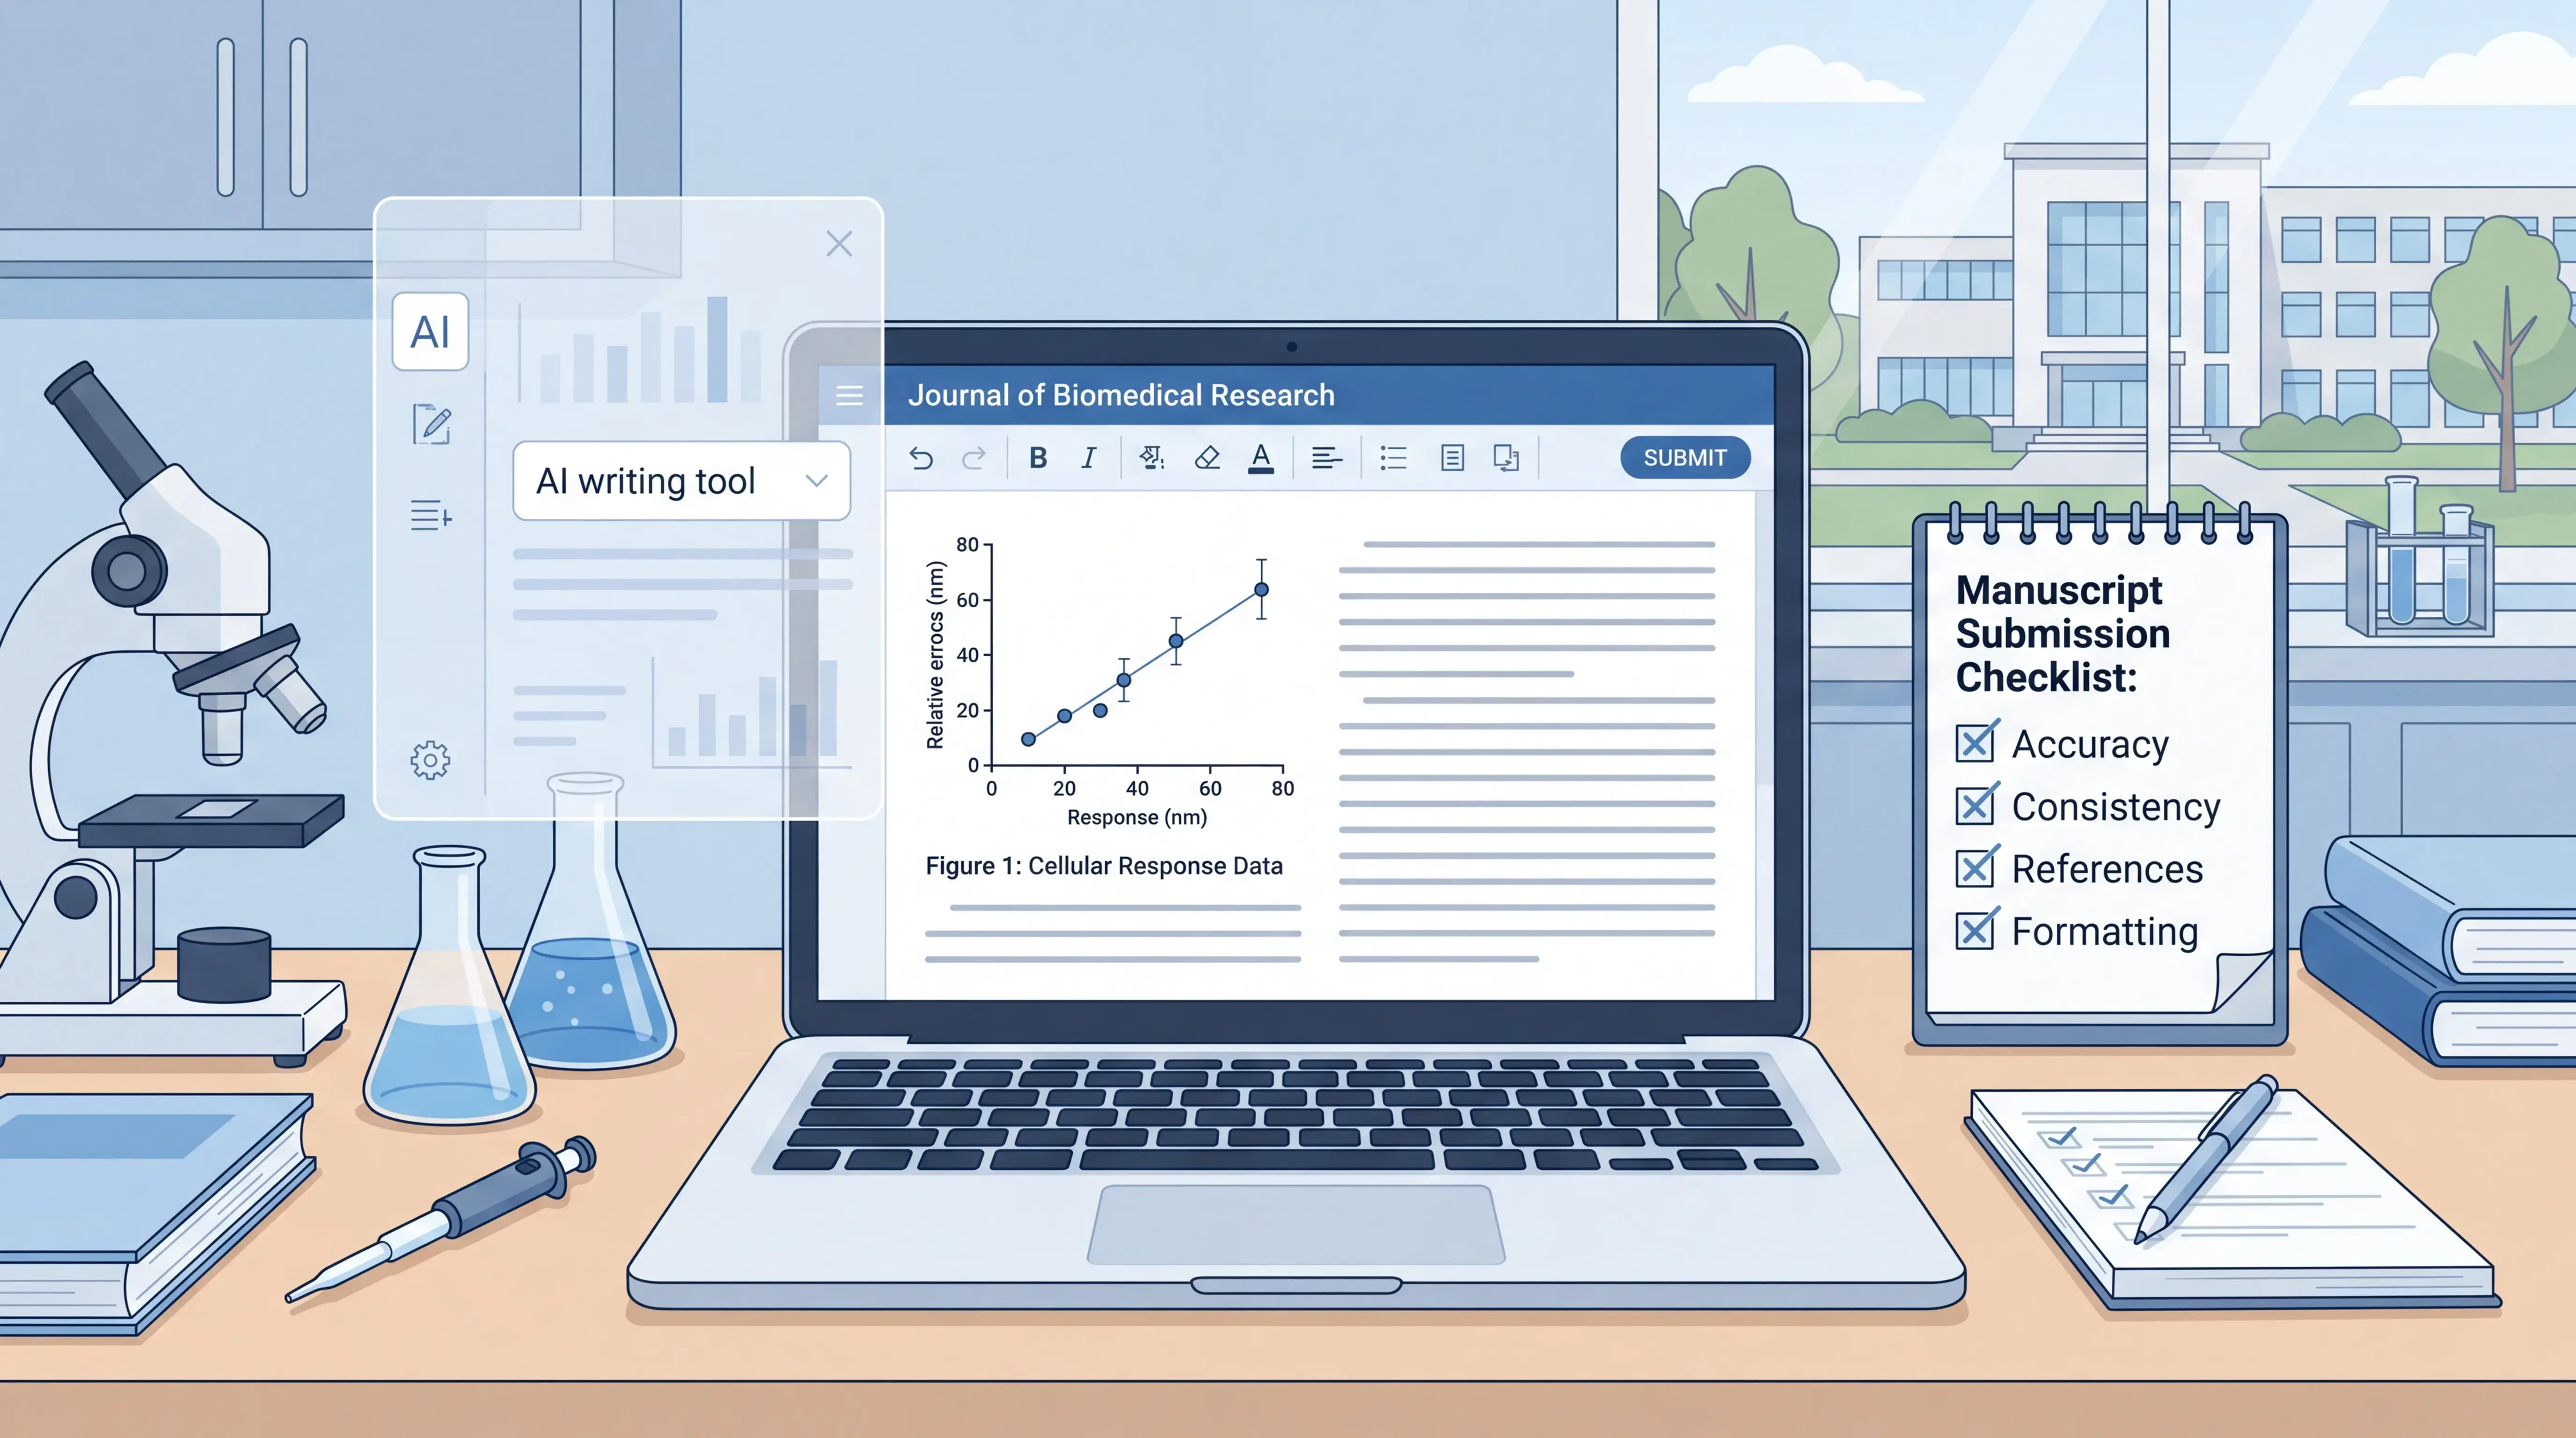
If you want fewer mistakes and faster revision cycles, tools like scifocus.ai can help streamline scientific writing and figure preparation. A platform that supports structured drafting and consistency checking can reduce avoidable errors before submission.
The goal is not just to make figures faster. The goal is to make them correct the first time. For busy clinicians and researchers, that can save time, protect credibility, and improve publication readiness.
Conclusion
Error bars are small, but their impact is large. To present them correctly, you need the right error type, clear legend language, consistent typography, accurate statistics, and a layout that matches the logic of the study. How to present error bars correctly in scientific figures comes down to one principle. Make every visual choice support the data.
If you want a more efficient workflow, consider using scifocus.ai to reduce formatting errors and keep your scientific writing and figures consistent from draft to submission.
Did you like this article? Explore a few more related posts.
Start Your Research Journey With Scifocus Today
Create your free Scifocus account today and take your research to the next level. Experience the difference firsthand—your journey to academic excellence starts here.