

Odds Ratio vs Relative Risk in Medical Studies
Introduction
When researchers compare outcomes in clinical studies, odds ratio vs relative risk is one of the most misunderstood topics. Many readers can calculate a number, but still struggle to interpret it correctly. This matters in medical essays, because the wrong metric can change the clinical message, the strength of evidence, and even the conclusion.
1. Why This Comparison Matters
1.1 The Core Problem in Clinical Interpretation
In medical research, exposure and outcome are often summarized as a binary result. A patient either has the event or does not. In this setting, the choice between odds ratio vs relative risk is not just technical. It affects how clinicians understand harm, benefit, and study validity.
Relative risk is usually easier to explain. It answers a direct question: how many times more likely is the event in one group than in another?
Odds ratio is more flexible, but less intuitive. It is common in case-control studies and works across study designs, yet it is harder to explain in clinical language.
A strong medical essay should not treat these measures as interchangeable. They serve different purposes. The wrong choice can distort interpretation, especially when the event is common.
1.2 What “Risk” and “Odds” Mean
Risk is the probability that an event occurs. If 20 out of 100 patients develop an outcome, the risk is 20%.
Odds compare events to non-events. In the same example, the odds are 20 to 80, or 0.25.
This difference is the heart of the odds ratio vs relative risk debate. Risk ratio compares probabilities directly. Odds ratio compares odds. They are close when the event is rare, but they can diverge as event rates rise.
2. How Relative Risk Works
2.1 The Most Clinically Intuitive Measure
Relative risk, also called risk ratio, is often the best choice when it can be calculated. It is common in cohort studies and randomized trials. It tells you how much more often an outcome occurs in the exposed group than in the unexposed group.
For example, if 10% of patients in one group and 5% in another group develop an event, the relative risk is 2.0. That means the event occurs twice as often in the first group.
This is why relative risk is preferred when interpretation matters. It is direct, clinically meaningful, and easier to communicate to doctors, students, and patients.
2.2 When Relative Risk Cannot Be Used
Relative risk requires incidence data. If a study design cannot provide a true denominator for each group, RR cannot be computed. This is common in case-control studies, where researchers start with disease status and then look backward for exposure.
In those cases, odds ratio vs relative risk is not a real choice. RR is not available, so OR becomes the main option. That is why OR dominates case-control research.
2.3 Why RR Is Often Preferred
Among common effect measures for categorical outcomes, RR is usually the first choice when available. It is easier to explain than OR and more stable than risk difference in many settings.
A practical hierarchy is often:
- Relative risk, if incidence can be calculated.
- Odds ratio, if RR is not available.
- Risk difference, as a complementary measure.
This is not absolute, but it reflects how many methodologists approach categorical outcomes in clinical research.
3. How Odds Ratio Works
3.1 What Odds Ratio Actually Measures
The odds ratio compares the odds of an event in one group with the odds in another group. It is calculated from a 2x2 table using the original counts of events and non-events.
If you have four cells, often written as a, b, c, and d, you can compute OR directly. That is one reason it is so widely used in statistical analysis and meta-analysis.
Odds ratio vs relative risk becomes important here because OR is mathematically convenient, but clinically less transparent. Many readers confuse OR with RR, especially when interpreting results from observational studies.
3.2 Where OR Is Most Common
OR is especially useful in:
- Case-control studies.
- Studies using logistic regression.
- Meta-analyses that combine binary outcomes.
- Situations where only 2x2 table data are available.
In case-control studies, OR is not just common. It is usually the only valid association measure, because RR cannot be directly estimated from the sampling design.
3.3 When OR Can Be Misleading
OR can exaggerate the appearance of effect when the event is common. This is a frequent source of confusion in clinical writing. For rare outcomes, OR may approximate RR well. But when event rates rise, the gap between the two widens.
For example, an OR of 2.0 does not always mean the risk is doubled. It means the odds are doubled. That distinction matters in medical interpretation and in any high-quality essay on epidemiologic methods.
4. Choosing the Right Measure in Medical Studies
4.1 Study Design Should Guide the Metric
The correct choice depends on the design:
- Cohort studies: RR is often preferred, because incidence can be measured.
- Randomized trials: RR is usually easy to calculate and interpret.
- Case-control studies: OR is the standard choice.
- Time-to-event analysis: Hazard ratio is often reported, and its clinical interpretation is closer to RR, but it includes time.
So, odds ratio vs relative risk is not a universal either-or question. It depends on what the data can support.
4.2 Why a 2x2 Table Is Still Best
When reporting results, the original 2x2 table remains the most transparent format. If the raw counts are available, readers can calculate OR, RR, and confidence intervals themselves.
That matters for reproducibility. Once only transformed results are reported, some information is lost. Raw data preserve flexibility and make later reanalysis easier.
Best practice is to report the original counts whenever possible. If not, report the estimate with a 95% confidence interval.
4.3 How to Read the Confidence Interval
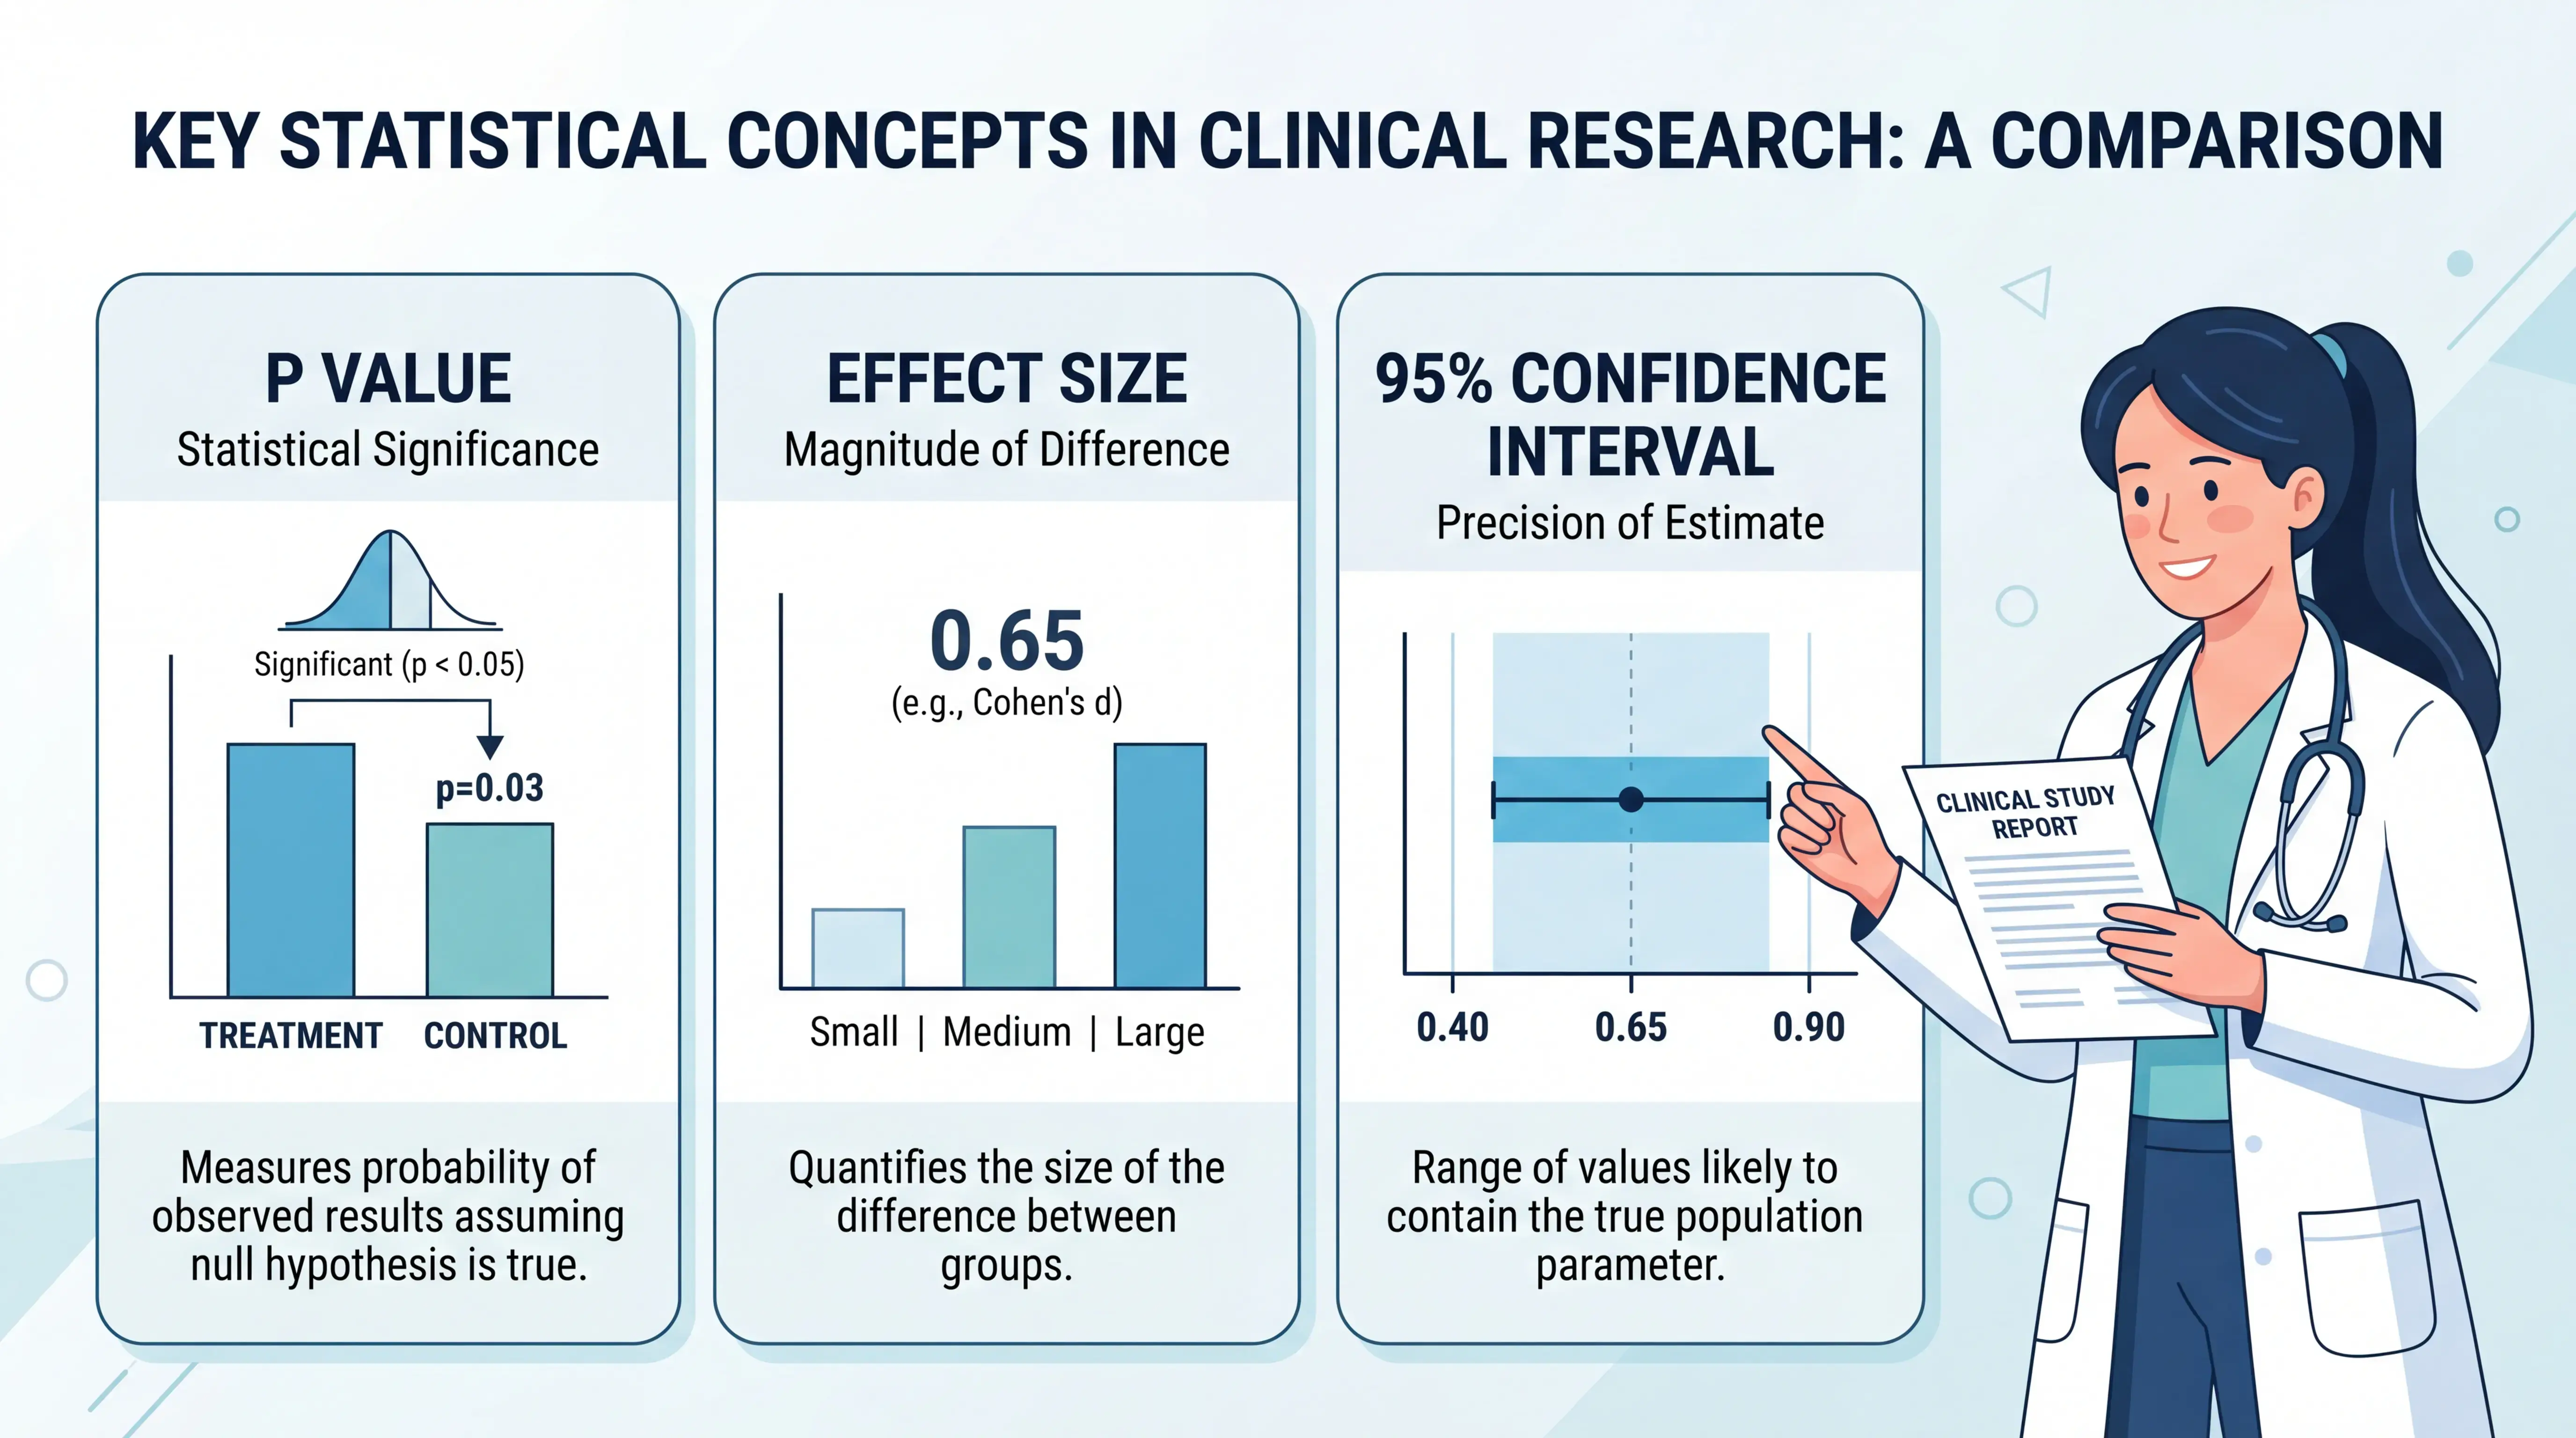
Whether you use OR or RR, the 95% confidence interval is essential. If the interval crosses 1, the result is not statistically significant at the conventional threshold.
But statistical significance is not the same as clinical importance. A small effect can be statistically significant in a large study. A larger effect may be non-significant in a small sample. A serious medical essay should distinguish these two ideas clearly.
5. How to Interpret Results Correctly
5.1 Do Not Assume “Below 1” Means Protective
A common mistake is to say that any RR or OR below 1 is protective and any value above 1 is harmful. That is too simplistic. Interpretation depends on how the outcome is defined.
If the outcome is death, a value below 1 may indicate benefit. If the outcome is recovery, the meaning changes. The direction of interpretation must follow the outcome definition, not the number alone.
This is one reason students often struggle with odds ratio vs relative risk in exams and research papers. The same value can mean different things in different contexts.
5.2 Low Event Rates Make OR Easier to Approximate
When the event is rare, OR and RR become closer. In such cases, OR can sometimes be interpreted in a way that approximates RR. But this should be done carefully and only when the event rate is low enough to justify it.
Do not convert OR into RR casually. That can create reporting errors. If exact interpretation matters, stay with the original measure and the raw table.
5.3 Hazard Ratio Is Related, but Not the Same
Hazard ratio often appears in survival analysis. It is not identical to RR, but clinically it is often read in a similar direction, because it reflects the rate of events over time.
For medical readers, this means the broader family of effect measures must be interpreted in context. Not every ratio has the same meaning, even when the numbers look similar.
6. Practical Reporting Advice for Medical Essays
6.1 How to Write About These Measures
If you are writing an essay, paper, or research report, keep the language precise. Use terms correctly. A good structure is:
- State the study design.
- Identify whether incidence can be calculated.
- Choose RR if possible.
- Use OR when RR is not available.
- Report the 95% confidence interval.
- Include raw counts whenever possible.
This simple structure improves clarity and reduces misinterpretation.
6.2 A Simple Writing Rule
Use relative risk when you can. Use odds ratio when you must.
That sentence captures the practical logic behind most categorical medical research.
It also helps you write more accurately in an academic essay. Reviewers and clinicians expect the estimate to match the study design. If your wording is inconsistent, the methodology looks weak even if the numbers are correct.
6.3 How Scifocus.ai Can Help
If you need to write, refine, or organize a medical essay on epidemiology or clinical research methods, scifocus.ai can help you turn complex data into clear academic language. It supports structured drafting, concise phrasing, and research-focused editing, which is especially useful when explaining odds ratio vs relative risk without losing precision.
Conclusion
In medical studies, odds ratio vs relative risk is not a minor statistical detail. It is a core interpretation issue. RR is usually easier to understand and preferred when incidence is available. OR is essential in case-control studies and remains useful in many analytical settings, but it is less intuitive and can mislead when event rates are common.
For strong clinical writing, choose the measure that matches the design, report raw data when possible, and interpret confidence intervals correctly. If you want to produce a clearer, more professional medical essay, use scifocus.ai to support your writing workflow and improve the clarity of your research communication.
Did you like this article? Explore a few more related posts.
Start Your Research Journey With Scifocus Today
Create your free Scifocus account today and take your research to the next level. Experience the difference firsthand—your journey to academic excellence starts here.