

How to Describe Statistical Results in Writing
Introduction
Writing an essay on statistical results is not just about reporting numbers. It is about turning data into a clear, credible story. Many medical students, doctors, and researchers struggle with what to include, what to leave out, and how to avoid overexplaining results. The key is to present findings objectively, in a logical order, with only the most relevant statistics.
1. Understand What Statistical Results Should Do
1.1 Report findings, not interpretations
In a scientific essay, the results section answers one question: what did you find? It should describe observed outcomes clearly and directly. It should not explain why the results happened. That belongs in the discussion.
For example, write that a variable was higher in one group than another. Do not immediately explain the biological mechanism unless the journal or section specifically asks for it. A strong results section stays close to the data.
1.2 Keep the structure logical
The best order is not always the order of experiments. In many papers, the strongest or most novel finding should appear first. This is especially useful in medical and biomedical writing, where readers need to see the main discovery quickly.
A practical structure is:
- Start with the main pattern or difference.
- Move to supporting analyses.
- End with validation or subgroup findings.
This creates a clear narrative. It also helps readers follow the logic of the study without getting lost in technical detail.
1.3 Match text with figures and tables
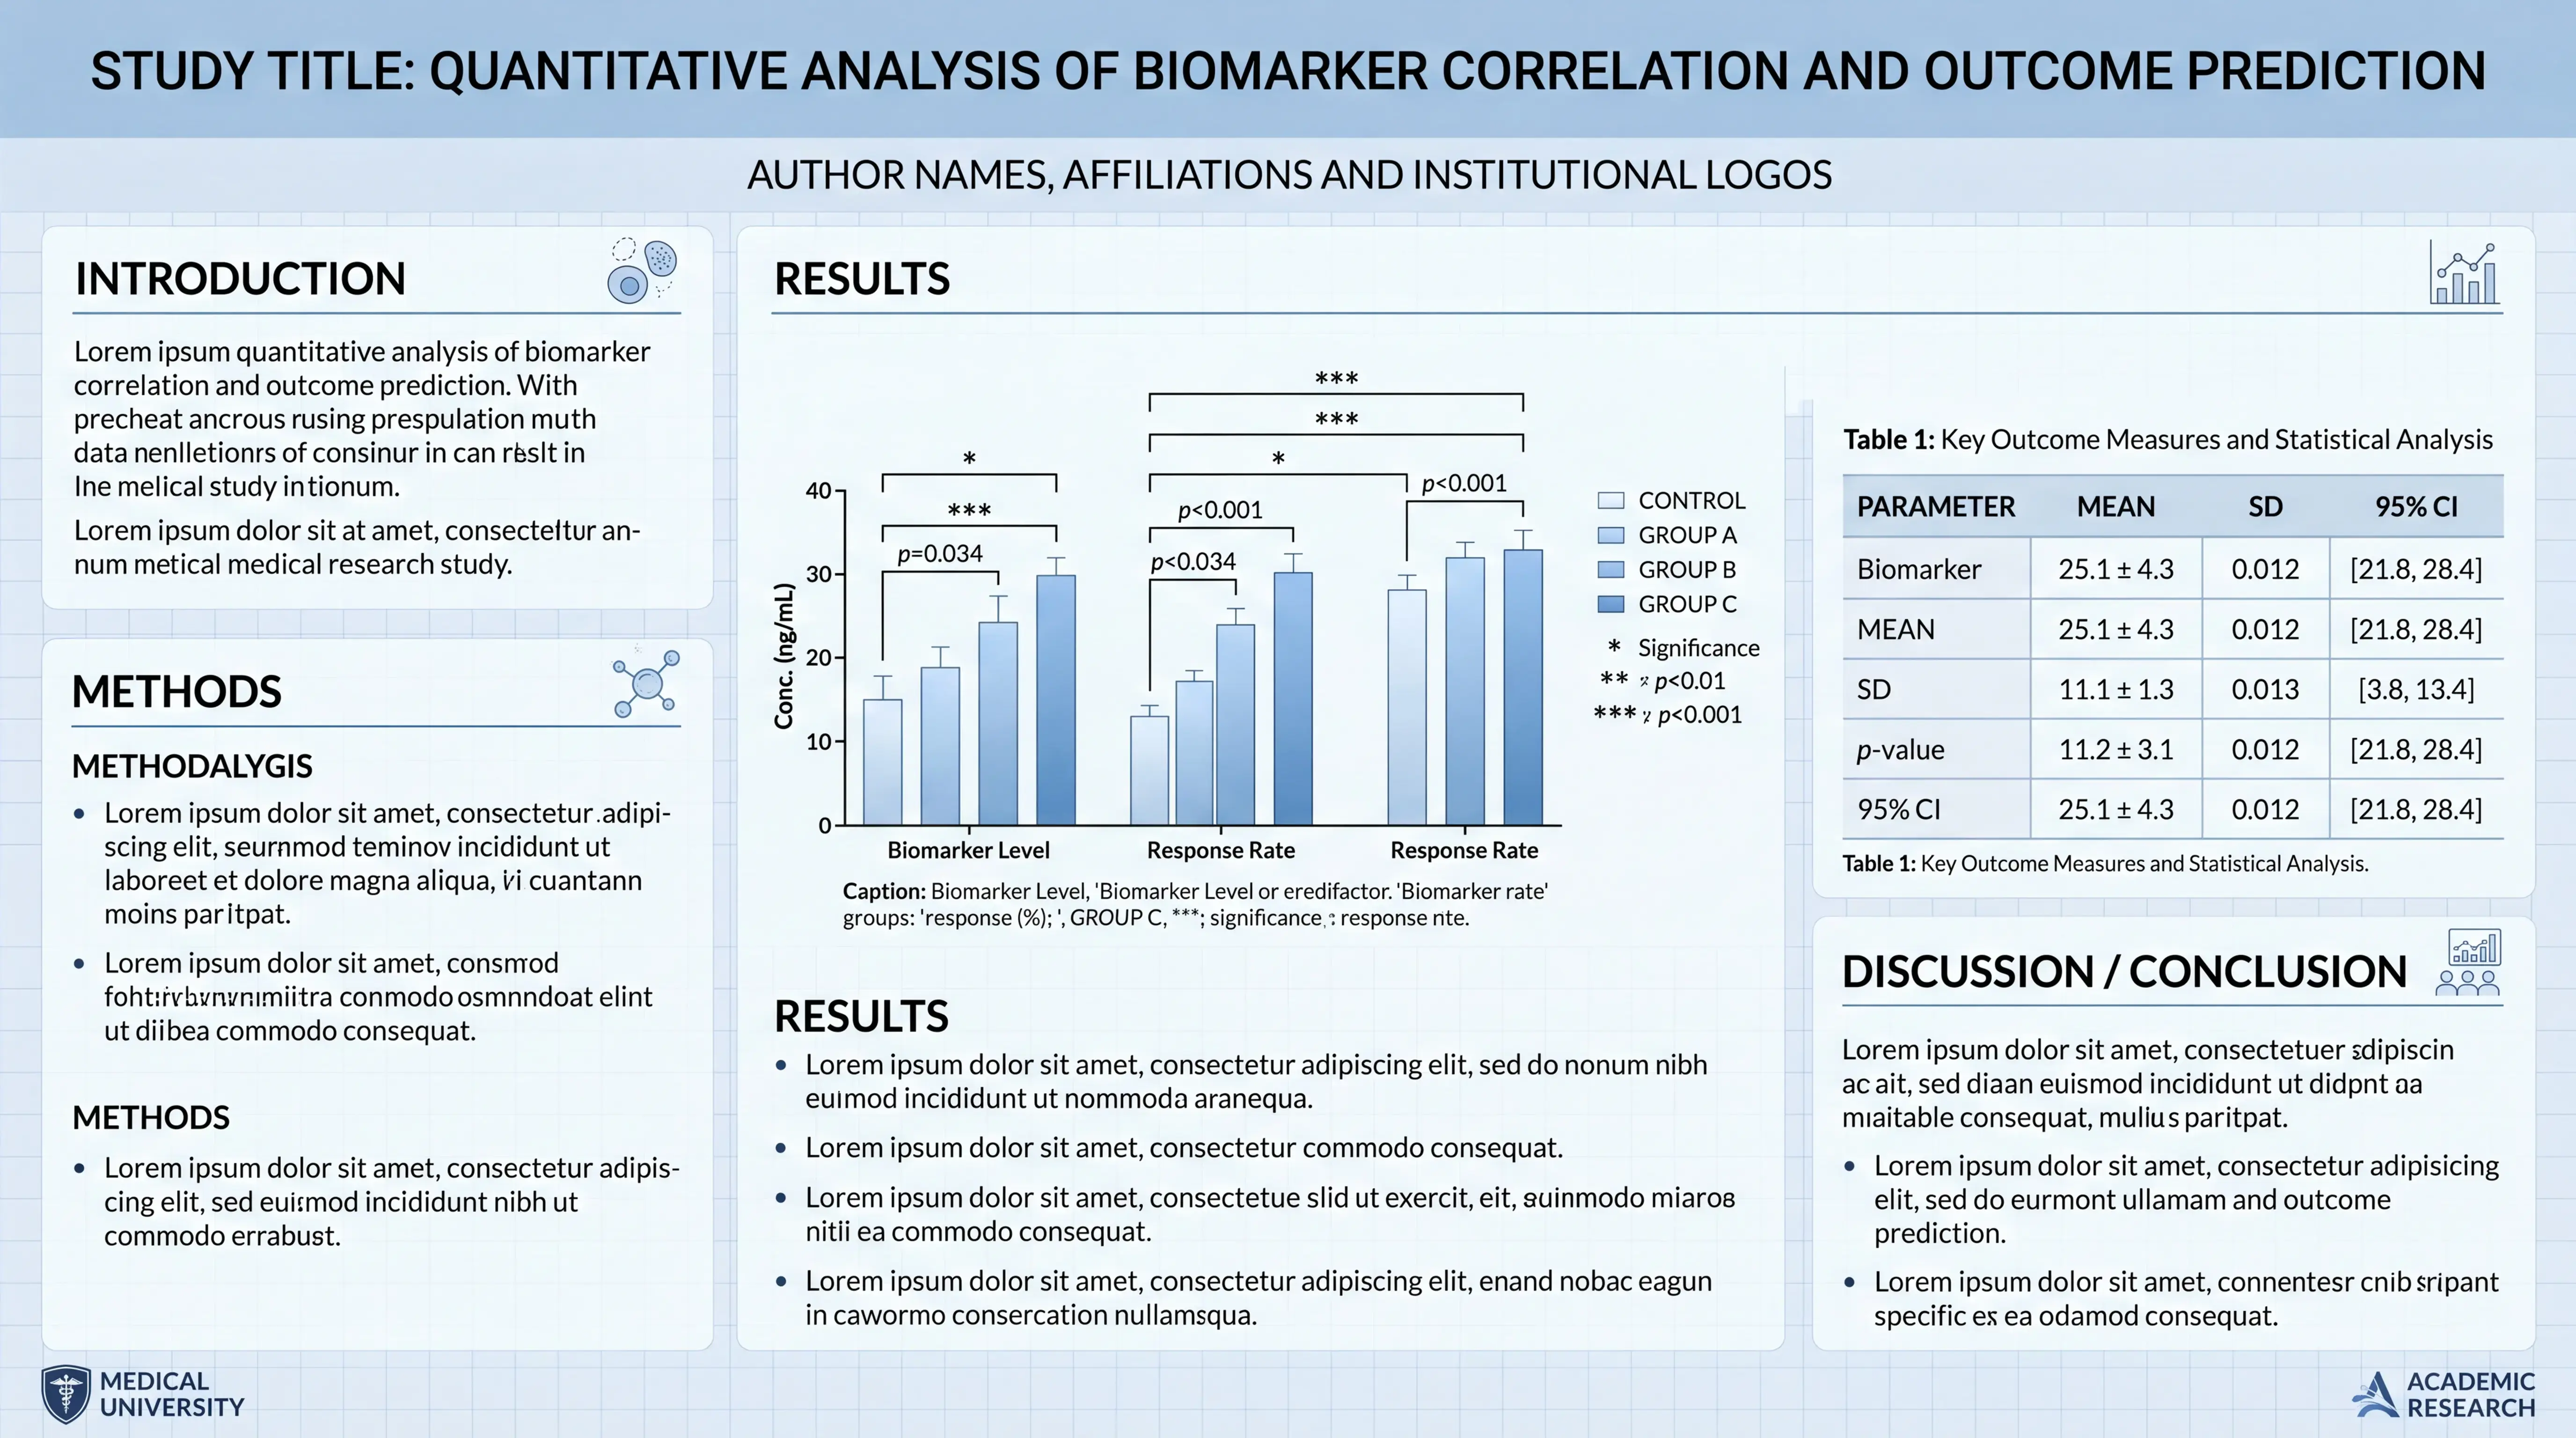
Good statistical writing depends on alignment. Every sentence should point to a figure, table, or statistical test that supports it. The text should not repeat every number in the visual. Instead, highlight the most important results.
A useful rule is this: let the figure show the full data, and let the text explain the key takeaway.
2. Use a Clear Results Structure
2.1 Start with the most important finding
In an effective essay, the first result often carries the main message. If your study identified a primary outcome, report it early. This is consistent with how strong scientific stories are built.
For example, if the key finding is a significant difference in biomarker expression, lead with that. Then add the secondary observations. This approach is common in high-quality journal writing because it improves readability and impact.
2.2 Organize by logic, not by lab routine
Research is often performed in one order, but written in another. In the lab, you may have run validation first and exploratory analysis later. In writing, the sequence should reflect meaning, not workflow.
A clear sequence is:
- Phenomenon first.
- Mechanism next.
- Functional validation last.
This pattern works well because it mirrors how readers think. It also helps the paper feel complete and coherent.
2.3 Use subsection headings
For longer papers, subsection headings improve readability. Each heading should reflect one result block, such as a comparison, correlation, or validation experiment.
Strong headings are specific. They should tell the reader what the section contains. For example:
- Clinical characteristics of the study cohort
- Group differences in biomarker levels
- Association between exposure and outcome
- Validation of the primary endpoint
This makes the essay easier to scan and easier to cite.
3. Write Statistics Precisely
3.1 Report the test and the result
When describing statistical results, include the relevant test, the direction of effect, and the significance level when needed. Do not bury the main message inside excessive detail.
A standard format may include:
- The test used
- The groups or variables compared
- The direction of the difference
- The exact p-value or confidence interval
For example, instead of writing only “there was a difference,” write that one group showed higher values than the other, supported by the statistical test. Specificity increases trust.
3.2 Use exact numbers when possible
Numbers matter. Readers expect clear values, not vague labels. If your paper includes means, medians, ratios, or percentages, present them consistently.
Useful habits include:
- Use the same decimal format throughout.
- Report p-values consistently.
- Keep units visible.
- Avoid mixing percentage and absolute values without explanation.
If a journal prefers exact p-values, do not replace them with broad labels like “significant” unless the style guide allows it. Precision is a sign of professional reporting.
3.3 Show only the data that support the message
A results section is not a data dump. You do not need to list every output from every test. Select the most representative and convincing findings.
This is especially important when a project generates many datasets. If two results are equally important, place one in the main text and one in supplementary material. That keeps the main essay focused and readable.
4. Avoid Common Writing Mistakes
4.1 Do not repeat the Methods section
One common error is rewriting the method in the results. That weakens the section. Readers do not need a full description of the procedure again.
A brief reminder is enough. For example, you may mention that an analysis was performed or that a comparison was tested. But do not explain the full protocol again. The results section should move forward, not circle back.
4.2 Do not interpret too early
Another common mistake is mixing results with discussion. For example, after reporting a significant difference, do not immediately speculate about the clinical mechanism unless that interpretation is necessary and restrained.
Instead, end each paragraph with a concise summary sentence. This helps the reader understand the finding without overloading the section with argumentation.
4.3 Do not exaggerate significance
Statistical significance is not the same as clinical importance. A small p-value does not automatically mean the finding matters in practice. If the effect size is small, report it honestly.
In medical writing, this is essential. A rigorous essay should distinguish between statistical evidence and real-world relevance. That is part of scientific credibility.
5. Use the Right Language and Tense
5.1 Use past tense for results
Results describe what was found in the study. Therefore, past tense is usually the correct choice.
Examples:
- The biomarker level increased.
- The treatment group showed lower risk.
- The analysis revealed a significant association.
This tense signals that the findings came from the completed study, not from general knowledge.
5.2 Keep the language direct
Use short, direct sentences. Avoid long chains of clauses. The more complicated the sentence, the harder it is to track the result.
A strong sentence often follows this pattern:
- What was tested
- What was found
- What it means in one brief line, without discussion
This style is concise and professional. It works especially well in journal manuscripts and academic essay writing.
5.3 Use a final summary sentence
Each result paragraph should end with one sentence that captures the core message. This is not a discussion. It is a compact statement of the finding.
For example, after several comparisons, a final sentence might state that the data support the primary outcome. This helps the section feel complete and controlled.
6. Build Trust with Clean Data Presentation
6.1 Keep figures neat and aligned
Tables and figures should be easy to read. Labels must be clear. Axis titles should be visible. Statistical symbols should follow one style across the paper.
If the visuals are messy, even strong data lose impact. In medical and research writing, presentation quality affects credibility. Clean formatting is part of scientific accuracy.
6.2 Use representative results
Not every result needs to be shown in full. Choose representative examples that support the conclusion. This is especially true in image-based data such as Western blots, flow cytometry plots, immunohistochemistry, or fluorescence images.
The goal is not to overwhelm the reader. The goal is to show enough evidence for the conclusion to be convincing.
6.3 Handle unexpected data honestly
If a result does not match the hypothesis, do not hide it. Report it honestly if it is relevant. Unexpected findings can add value, as long as they are presented objectively.
In scientific writing, transparency matters more than perfect-looking data. Honest reporting strengthens the paper and supports E-E-A-T standards.
7. A Practical Workflow for Better Statistical Writing
7.1 Write the figures first
A useful workflow is to prepare the figures and tables before drafting the text. Then write a short title or takeaway for each result block. After that, convert each takeaway into a paragraph.
This method saves time and improves logic. It also ensures that the text matches the visuals. For many researchers, this is the fastest way to write a stronger essay.
7.2 Draft in three steps
Use this simple sequence:
- State the purpose of the analysis.
- Present the key result.
- Add a brief concluding sentence.
This structure works across most medical and scientific manuscripts. It is concise, repeatable, and easy to revise.
7.3 Use tools to speed up drafting
If you write research content regularly, tools like scifocus.ai can help organize statistical outputs, streamline section drafting, and improve consistency across figures, tables, and text. That does not replace expert judgment. But it can reduce formatting friction and help you focus on interpretation quality.
For busy medical students, clinicians, and researchers, that efficiency matters. A better workflow means faster writing and cleaner results.
Conclusion
Describing statistical results well requires more than reporting numbers. It requires structure, precision, and restraint. Keep the focus on what the data show. Lead with the most important finding. Use past tense. Report statistics clearly. Avoid unnecessary interpretation.
If you want to write a stronger academic essay or manuscript faster, consider using scifocus.ai to support your drafting workflow and keep your results section clear, consistent, and publication-ready.

Did you like this article? Explore a few more related posts.
Start Your Research Journey With Scifocus Today
Create your free Scifocus account today and take your research to the next level. Experience the difference firsthand—your journey to academic excellence starts here.