

Common Mistakes in Reporting P Values and Effect Estimates
Introduction
In a medical essay, the way you report statistics can make or break your credibility. Many papers look polished on the surface, yet fail basic checks on p values, means, confidence intervals, or effect estimates. For medical students, doctors, and researchers, these errors are not minor. They can suggest weak methods, poor reporting, or even data problems. If your results are hard to trust, the whole study becomes hard to trust.
1. Why Statistical Reporting Errors Matter
1.1 P values are not enough
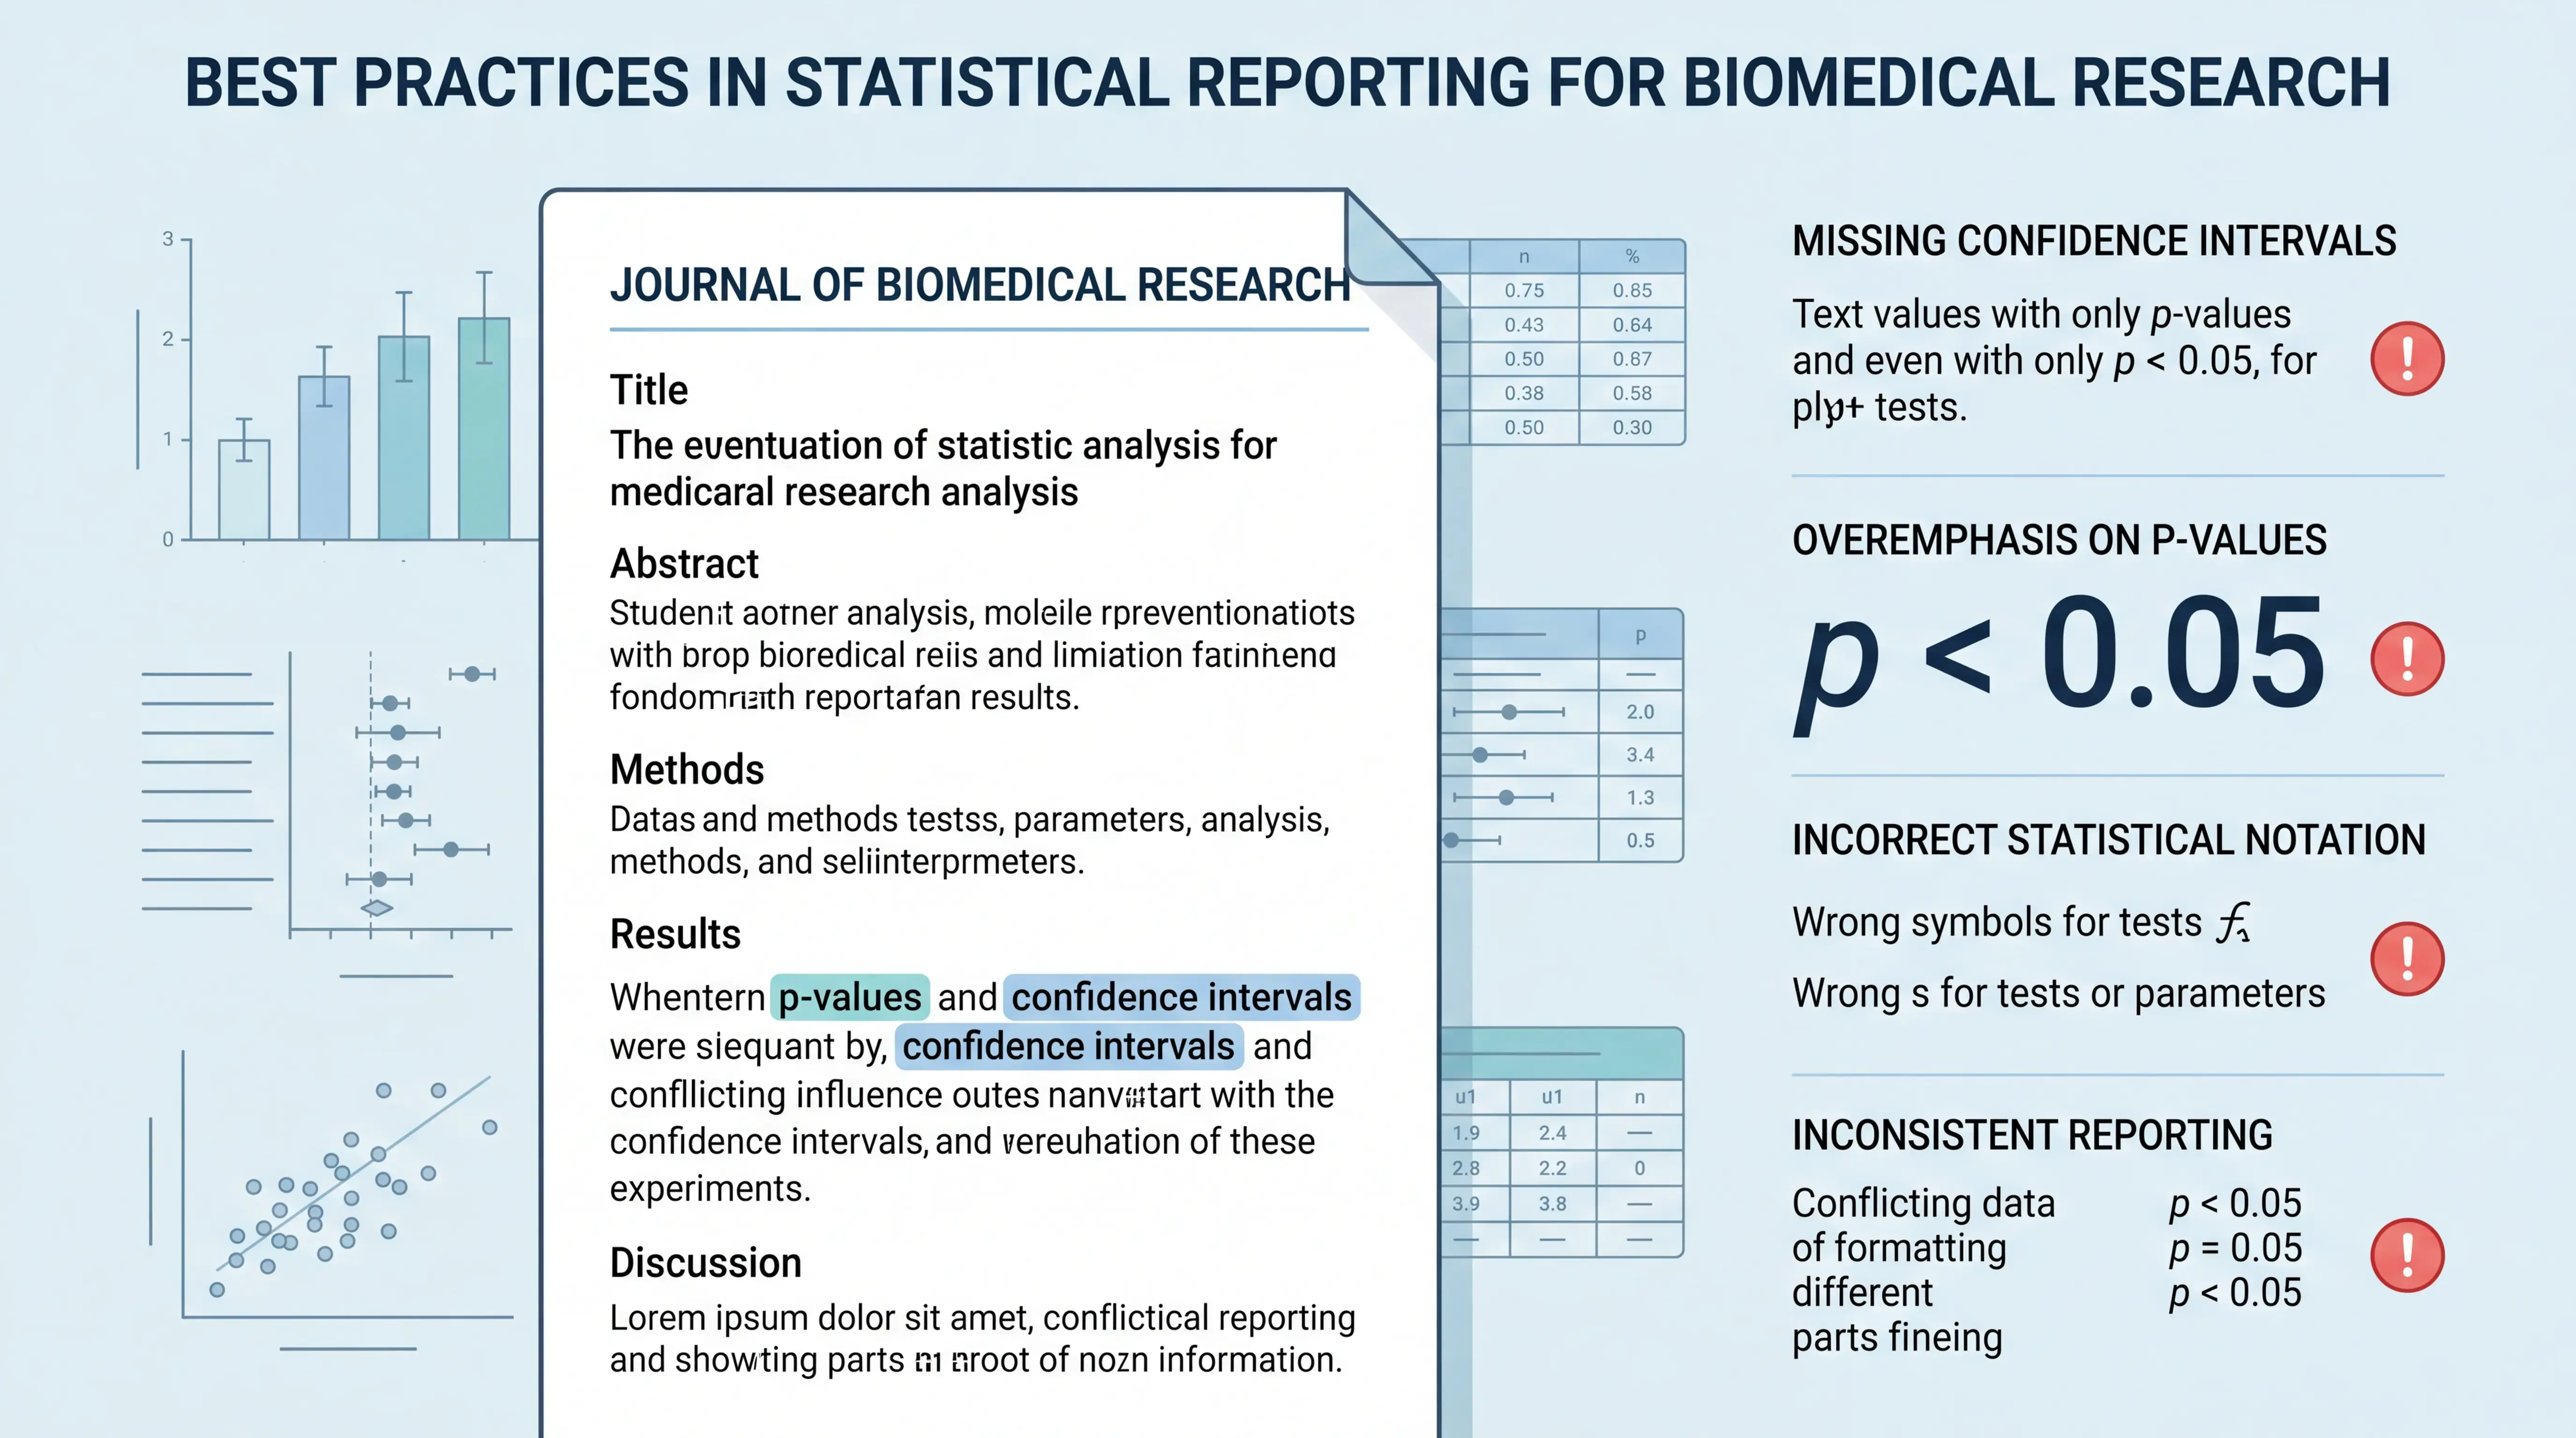
A p value only tells you whether an observed difference is compatible with chance under a null hypothesis. It does not tell readers how large the difference is, or whether it is clinically meaningful. That is why reporting only “p < 0.05” is incomplete.
A strong paper reports both statistical significance and effect size.
In clinical and biomedical research, readers need numbers that show magnitude. That includes means, odds ratios, relative risks, hazard ratios, mean differences, and confidence intervals. Without them, the result is vague.
1.2 Weak reporting can signal deeper problems
Some errors are simple writing mistakes. Others raise questions about data quality. For example, when a study reports impossible combinations of sample size, means, and ranges, the data deserve closer review.
A well-written essay on statistics should help readers judge whether the analysis is credible. It should not hide the structure of the data.
2. Common Mistakes in Reporting P Values
2.1 Reporting only “p < 0.05”
This is still common in older papers. But it is not best practice. Readers cannot judge the exact strength of evidence from a threshold alone.
Use the exact p value whenever possible. For example:
p = 0.032p = 0.214p < 0.001when the value is very small
Do not stop at “significant” or “not significant.”
2.2 Reporting p values without the test context
A p value should always be linked to a specific test and comparison. Was it from a t test, chi-square test, rank-sum test, or log-rank test? Was it between groups, before and after treatment, or across time points?
Without that context, the p value is incomplete. In an academic essay, this looks careless and weakens interpretation.
2.3 Multiple tests without a clear plan
Another common mistake is running several tests on the same variable and presenting all of them as if they were independent evidence. That can inflate false-positive findings.
For categorical outcomes, use the correct overall test first. For example, if a treatment outcome has three categories, a single 2×3 chi-square test is usually more appropriate than several separate tests.
One outcome should not be “proved” by repeating tests until the numbers look favorable.
3. Common Mistakes in Reporting Effect Estimates
3.1 Reporting p values without effect size
This is one of the biggest problems in medical writing. A tiny p value does not tell you whether the effect is large or clinically useful.
For binary outcomes, report:
- Risk ratio
- Odds ratio
- Risk difference
- 95% confidence interval
For continuous outcomes, report:
- Mean
- Standard deviation
- Mean difference
- 95% confidence interval
Effect estimates show size. P values show uncertainty. You need both.
3.2 Confusing means with impossible data patterns
One teaching example often seen in statistical training is a 9-point Likert scale reported with decimal means. The mean itself is not wrong, because it summarizes the sample. But the reported distribution should still make sense.
If a scale only allows integers from 1 to 9, and the sample size is small, the mean and standard deviation should be internally consistent with the raw scores. When the numbers do not fit, the reporting may be wrong or incomplete.
That does not automatically prove fraud. But it does mean the dataset needs careful checking.
3.3 Reporting means and SDs without checking distribution
Mean and standard deviation are most informative for roughly normal data. If the variable is strongly skewed, median and interquartile range may be better.
A careful essay on effect estimates should remind readers that descriptive statistics depend on the data type. Age, lab values, and scores may not all follow the same distribution.
4. Statistical Inconsistencies That Raise Red Flags
4.1 Impossible ranges and standard deviations
When a paper reports age ranges and means that do not fit the sample size or the spread, readers should be cautious. For example, if all ages are said to fall between 55 and 85 years, but the reported mean and standard deviation imply an extremely unlikely distribution, the numbers may be unreliable.
A useful check is simple:
- Compare the minimum and maximum with the mean.
- See whether the spread is plausible for the sample size.
- Ask whether the standard deviation fits the range.
If the numbers cannot reasonably coexist, the reporting is suspect.
4.2 Inconsistent test results
Another warning sign appears when different parts of the paper contradict each other. If one table suggests a larger difference, while the p value or test statistic implies the opposite, the result may have been copied incorrectly or calculated wrongly.
For t tests, the test statistic and p value must match the sample size and mean difference. If they do not, the result is not trustworthy.
4.3 Excessive use of vague language
Statements like “there was a difference” or “the treatment was effective” are not enough. They should be backed by numbers.
In scientific writing, vague statements weaken confidence. A good essay uses precise numeric evidence, not general claims.
5. How to Report Results Correctly
5.1 For randomized and non-randomized studies
The reporting standard depends on study design. RCTs should follow CONSORT. Observational studies often follow STROBE. Non-randomized interventions may follow TREND.
For RCTs, the report should usually include:
- Participant flow
- Baseline characteristics
- Primary and secondary outcomes
- Effect estimates with confidence intervals
- Exact p values where appropriate
Good reporting starts with the design, not with the p value.
5.2 For continuous outcomes
If the outcome is continuous, report the group mean and standard deviation at each relevant time point. If the study uses change scores, report those too.
A clear format is:
- Intervention group mean ± SD
- Control group mean ± SD
- Mean difference
- 95% confidence interval
- Exact p value
If there are more than two groups, use ANOVA or another appropriate model rather than forcing pairwise comparisons without a plan.
5.3 For binary outcomes
Binary outcomes need both the raw numbers and the effect estimate. For example:
- Events / total in each group
- Relative risk or odds ratio
- 95% confidence interval
- p value
This gives readers the full picture. A p value alone does not.
5.4 For survival outcomes
Survival data should be shown with Kaplan-Meier curves and reported with hazard ratios, confidence intervals, and log-rank p values. The curve tells the direction over time. The hazard ratio gives the effect size.
A survival analysis without an effect estimate is incomplete.
6. Practical Checks Before You Submit
6.1 Verify numerical consistency
Before submission, check whether all numbers agree.
- Does the mean fit the sample size?
- Does the SD fit the reported range?
- Does the test statistic match the p value?
- Does the effect estimate match the raw counts?
This takes time, but it protects your credibility.
6.2 Match the statistic to the question
Do not use t tests for every outcome. Do not use chi-square tests for every categorical table. Choose the method based on the variable type and study question.
That principle is central to sound research writing. A strong essay on medical statistics should never treat one test as a universal solution.
6.3 Report enough detail for readers to verify
A reviewer should be able to follow your logic from raw data to conclusion. If they cannot, the analysis is too opaque.
Better reporting means:
- Clear methods
- Correct test choice
- Exact p values
- Meaningful effect sizes
- Confidence intervals
- Transparent tables and figures
7. How scifocus.ai Can Help
7.1 Faster, cleaner statistical writing
Many reporting problems happen because authors rush. They copy templates. They forget exact p values. They mix up effect estimates and significance tests. They also miss internal inconsistencies that reviewers catch quickly.
This is where scifocus.ai can help. It supports more structured academic writing and helps researchers produce cleaner, more consistent drafts.
7.2 Better structure for publication-ready output
For medical students, clinicians, and researchers, the main value is efficiency with control. You still need judgment. But you save time on formatting, organization, and clarity.
That matters because strong reporting is not only about numbers. It is also about how clearly the numbers are presented. When your manuscript is easier to read, it is easier to trust.
Conclusion
Common mistakes in reporting p values and effect estimates can make a good study look weak, and a weak study look worse. The fix is straightforward. Report exact p values, pair them with effect sizes, match the test to the data, and check every number for consistency. Do not let statistics undermine your research story. If you want cleaner academic writing and a more efficient workflow, explore scifocus.ai for your next manuscript.
Did you like this article? Explore a few more related posts.
Start Your Research Journey With Scifocus Today
Create your free Scifocus account today and take your research to the next level. Experience the difference firsthand—your journey to academic excellence starts here.